Studio work
Year
2026
Interactive web visualisation, accessible at flutter-and-fall.netlify.app
Flutter & Fall demonstrates the potential of interactive data visualisation to bring ecological research to new audiences, and is particularly relevant for conservation organisations, research institutions, and environmental communications.
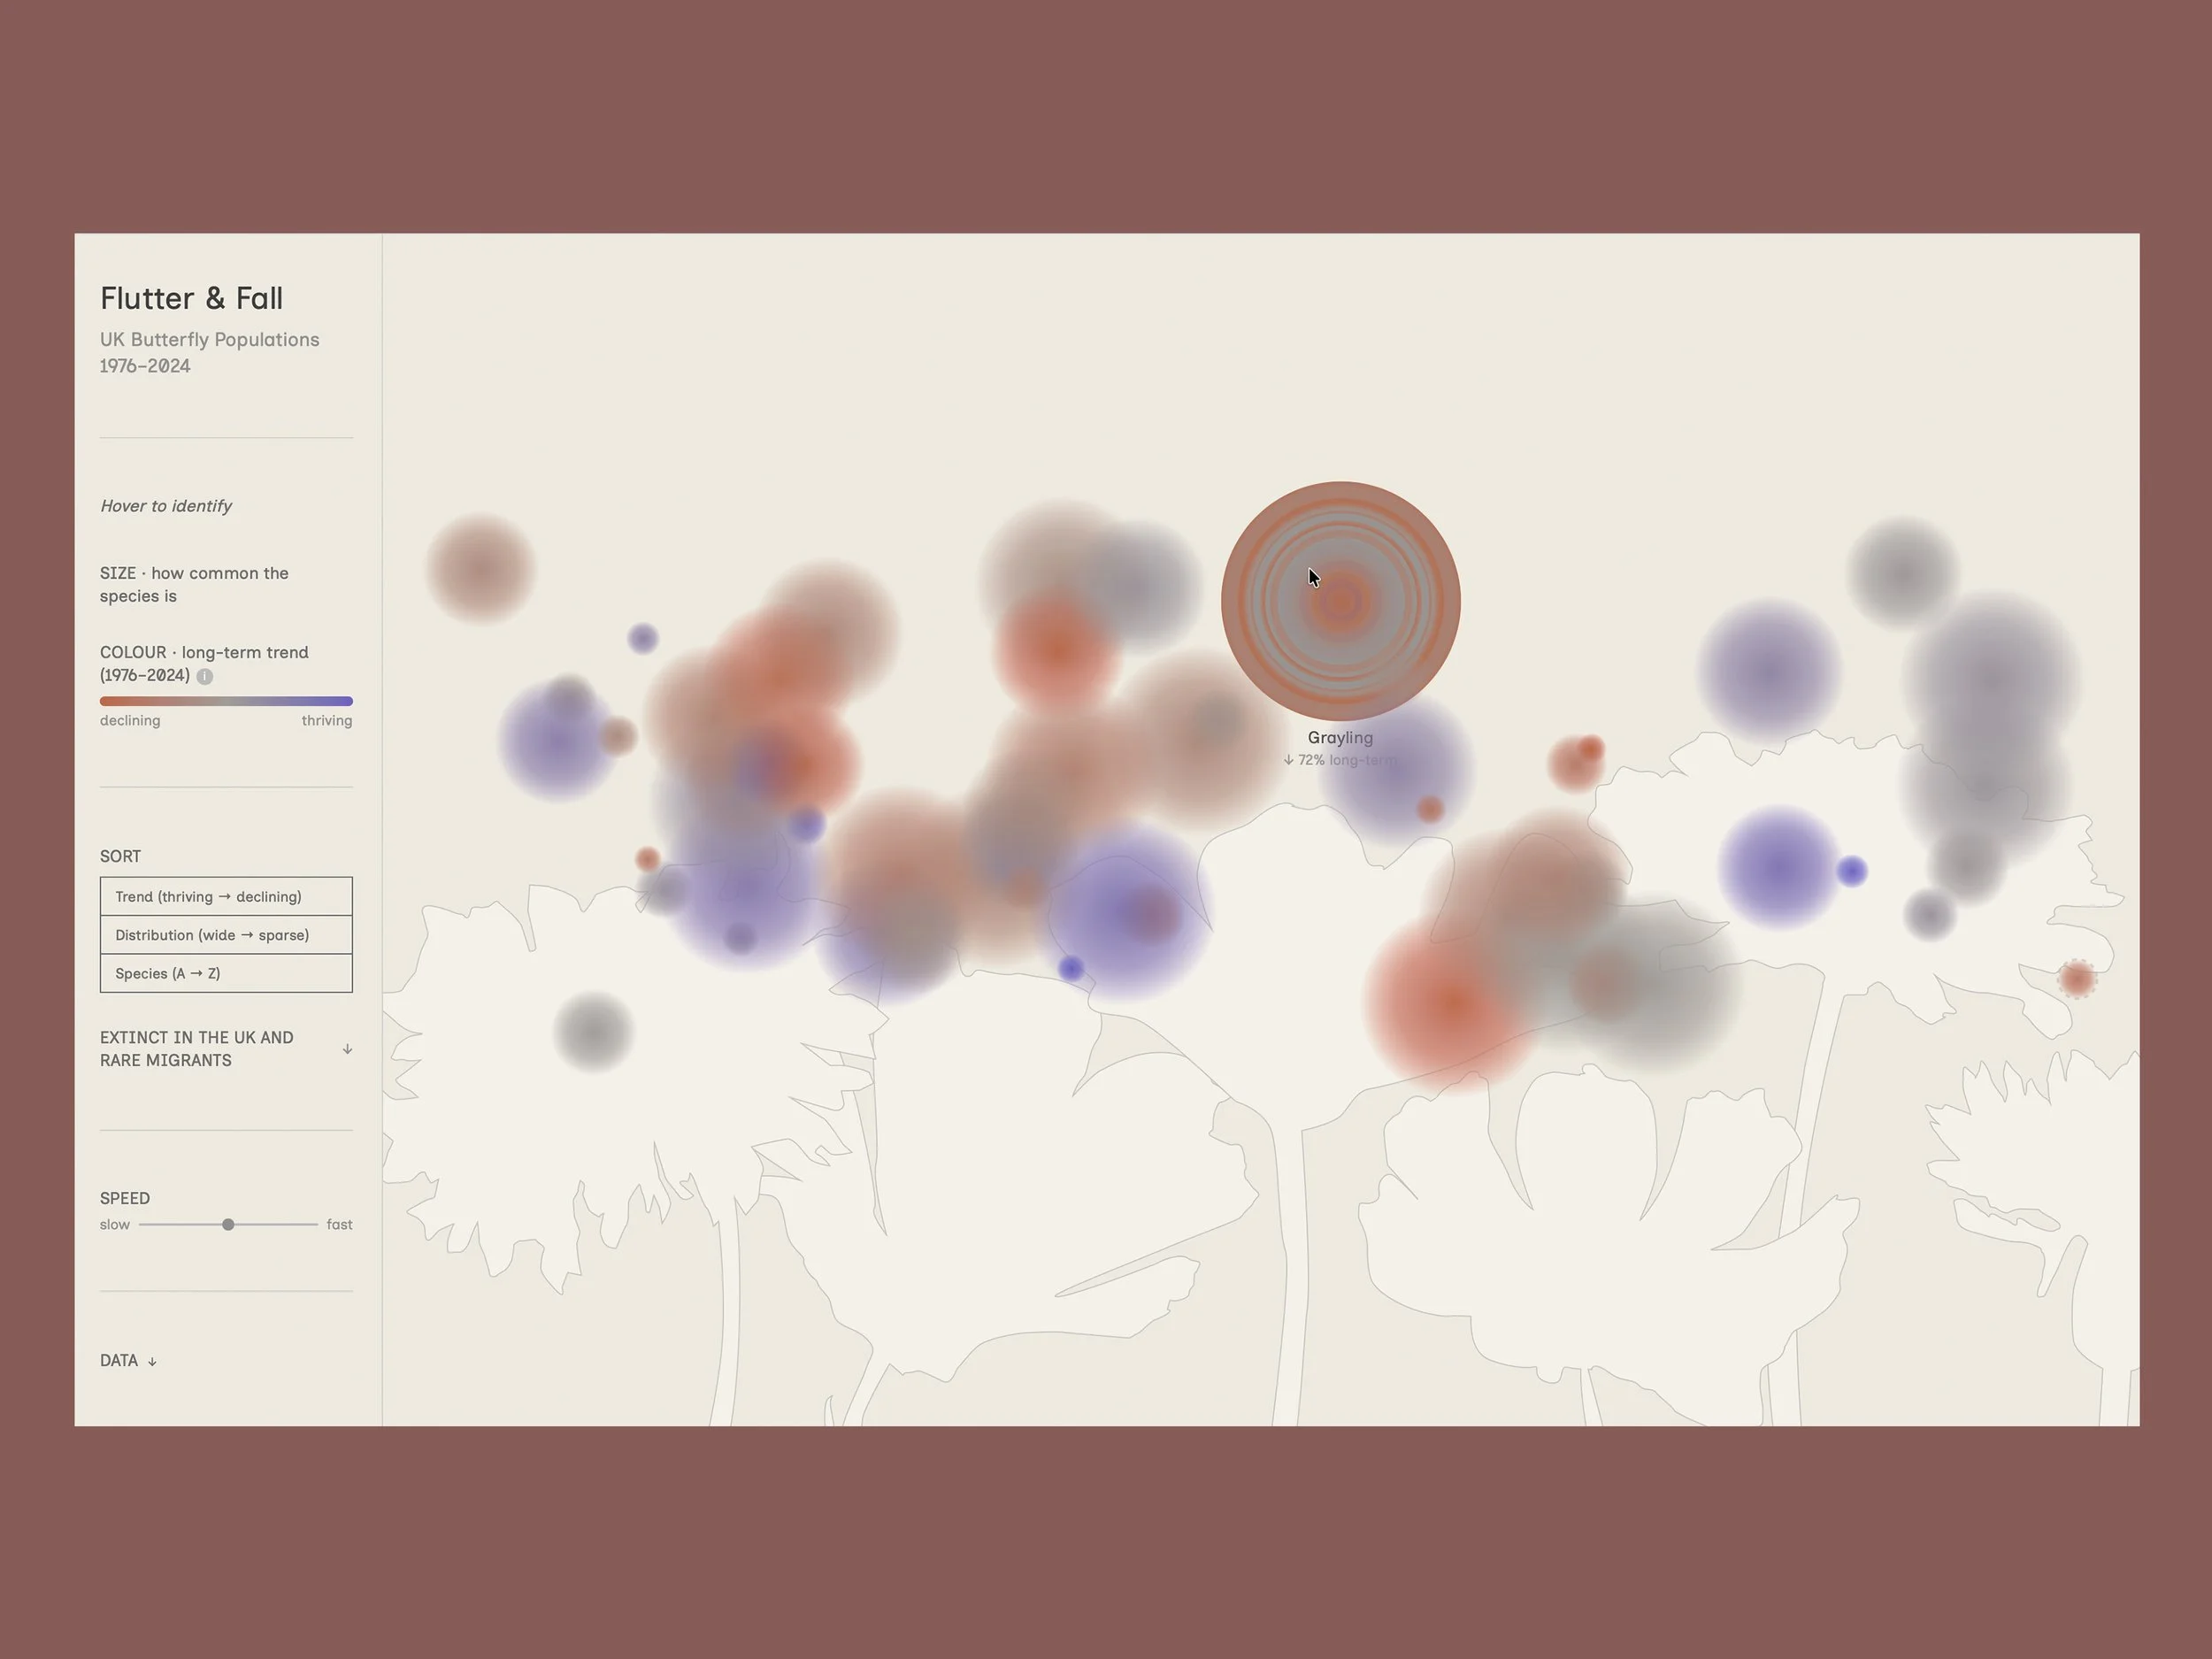
UK butterfly populations have undergone dramatic change since systematic monitoring began in 1976 — some species declining by more than 80%, others recovering significantly through targeted conservation. The scientific data behind these stories is robust and detailed, held within specialist datasets and technical reports. The challenge was to find a visual form that could communicate the scale and diversity of these changes in a way that creates an emotional response, and rewards deeper exploration without oversimplifying the underlying data.
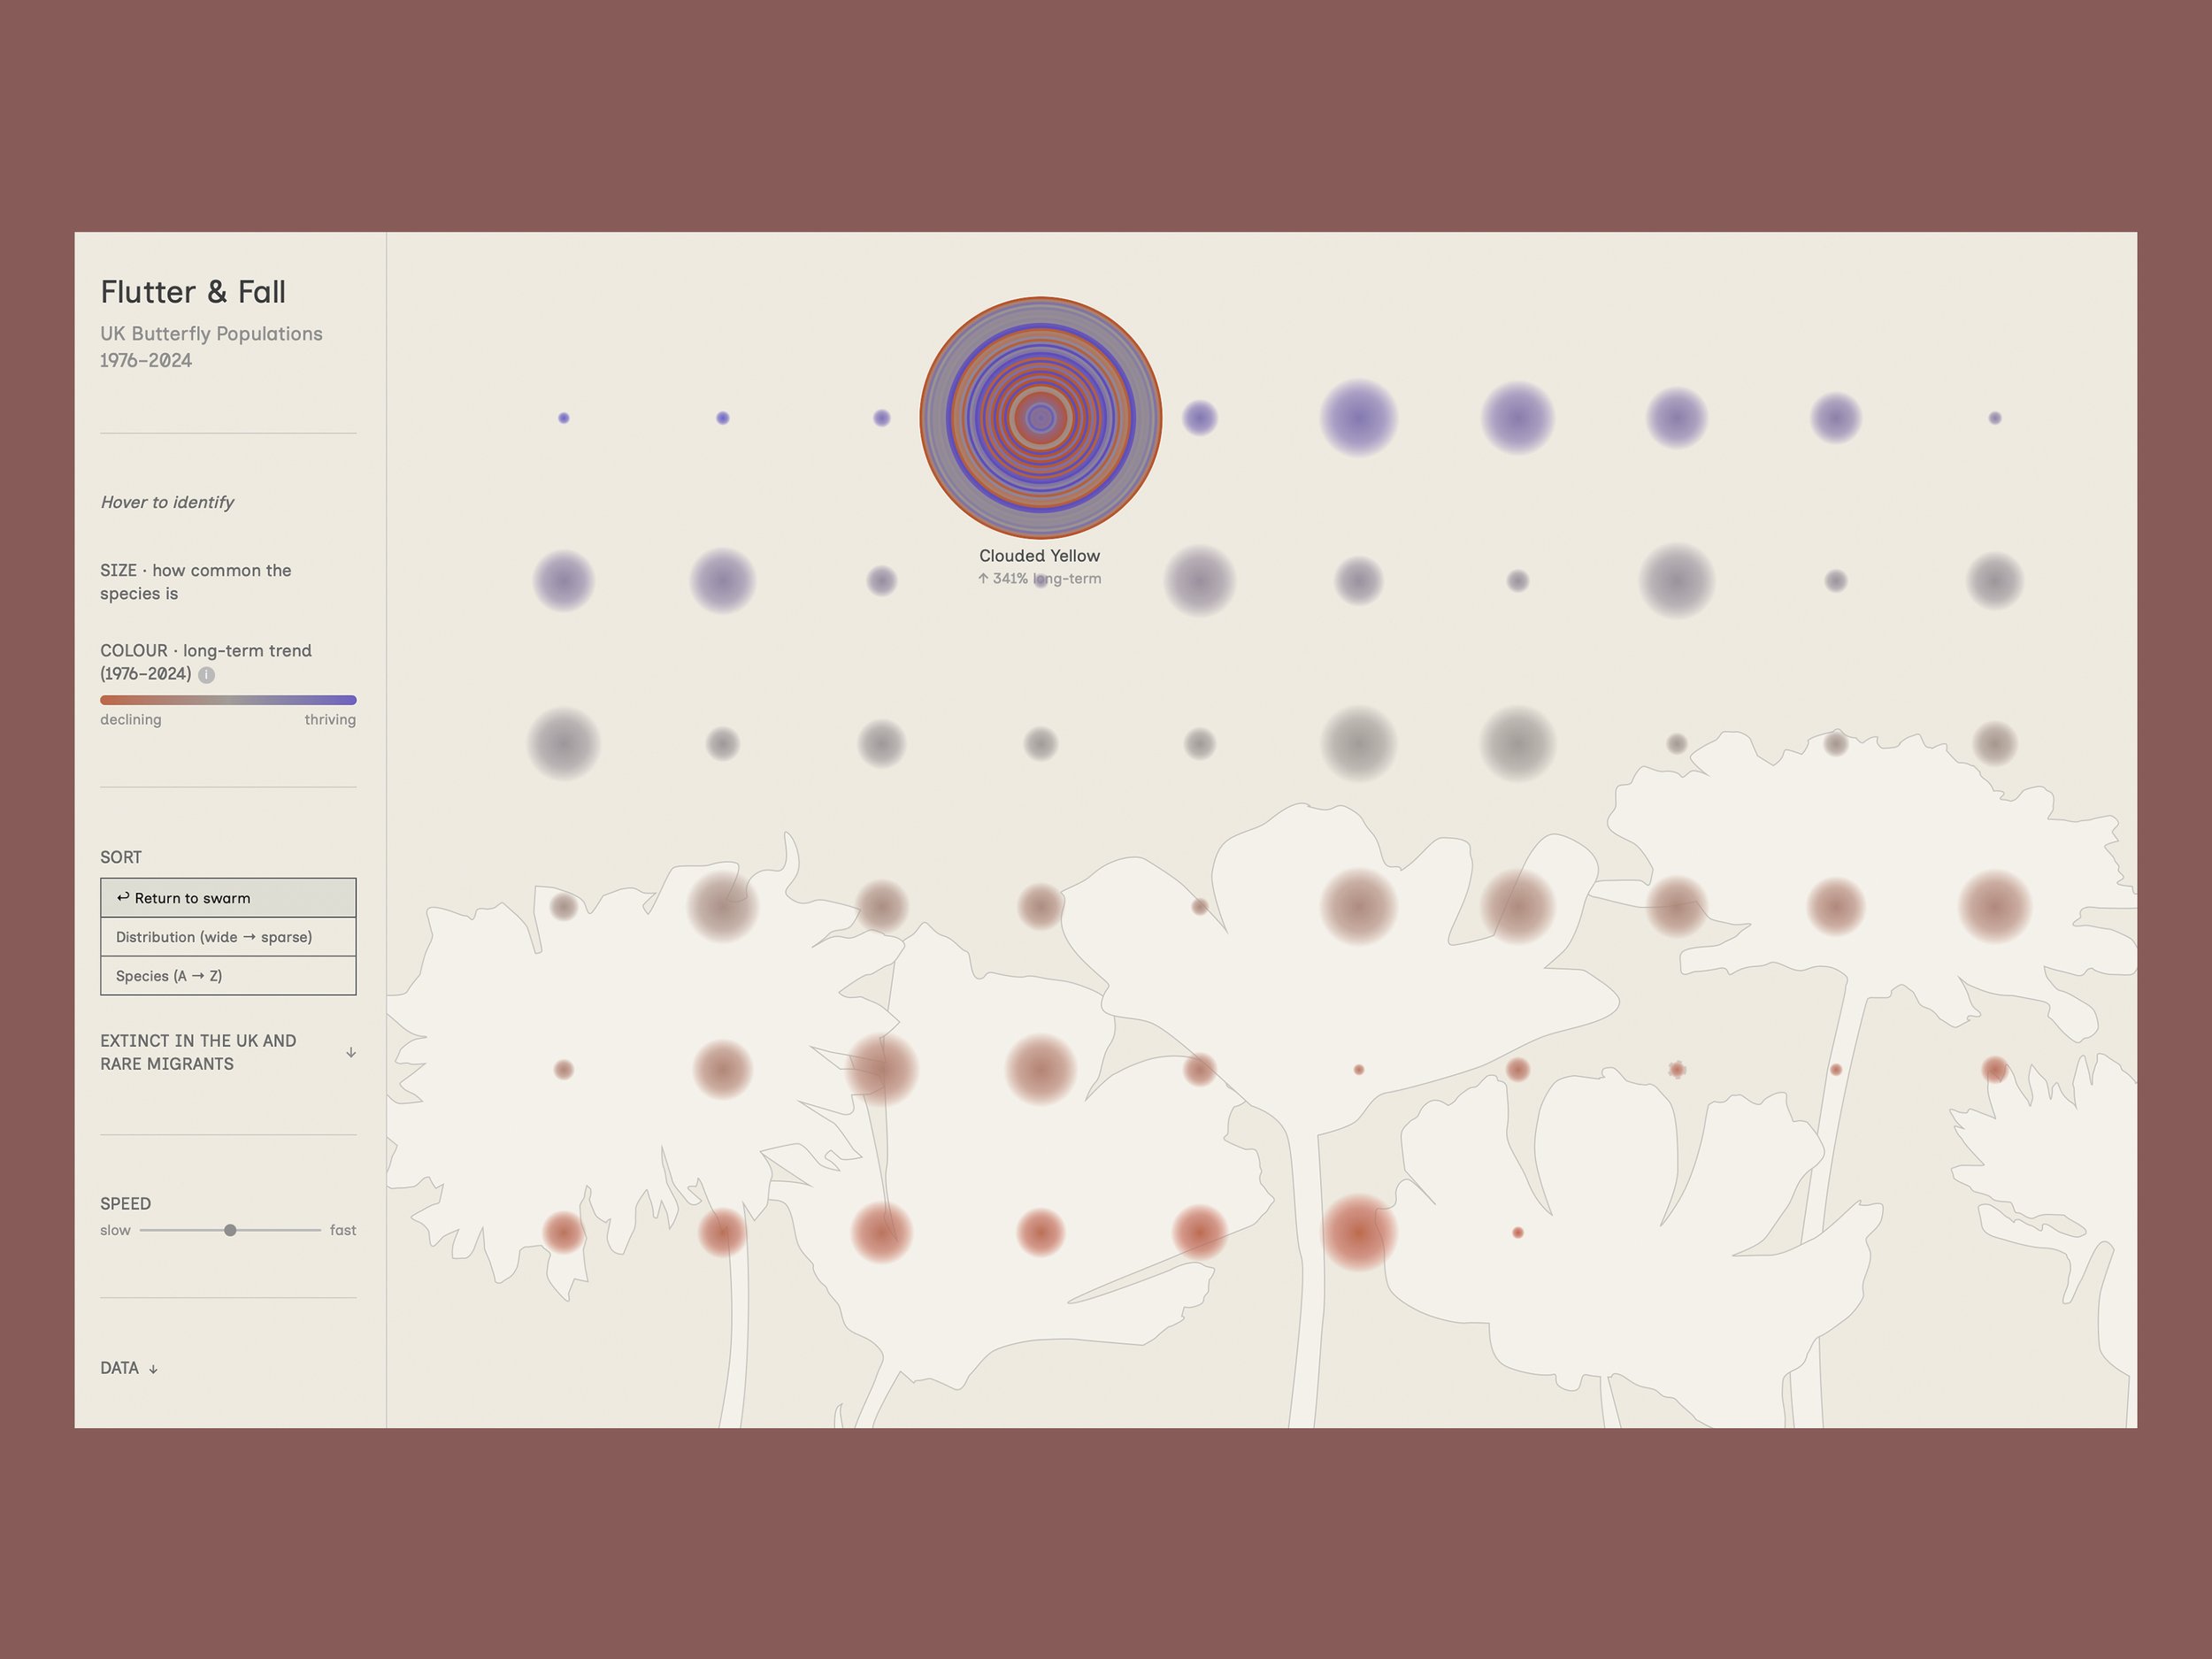
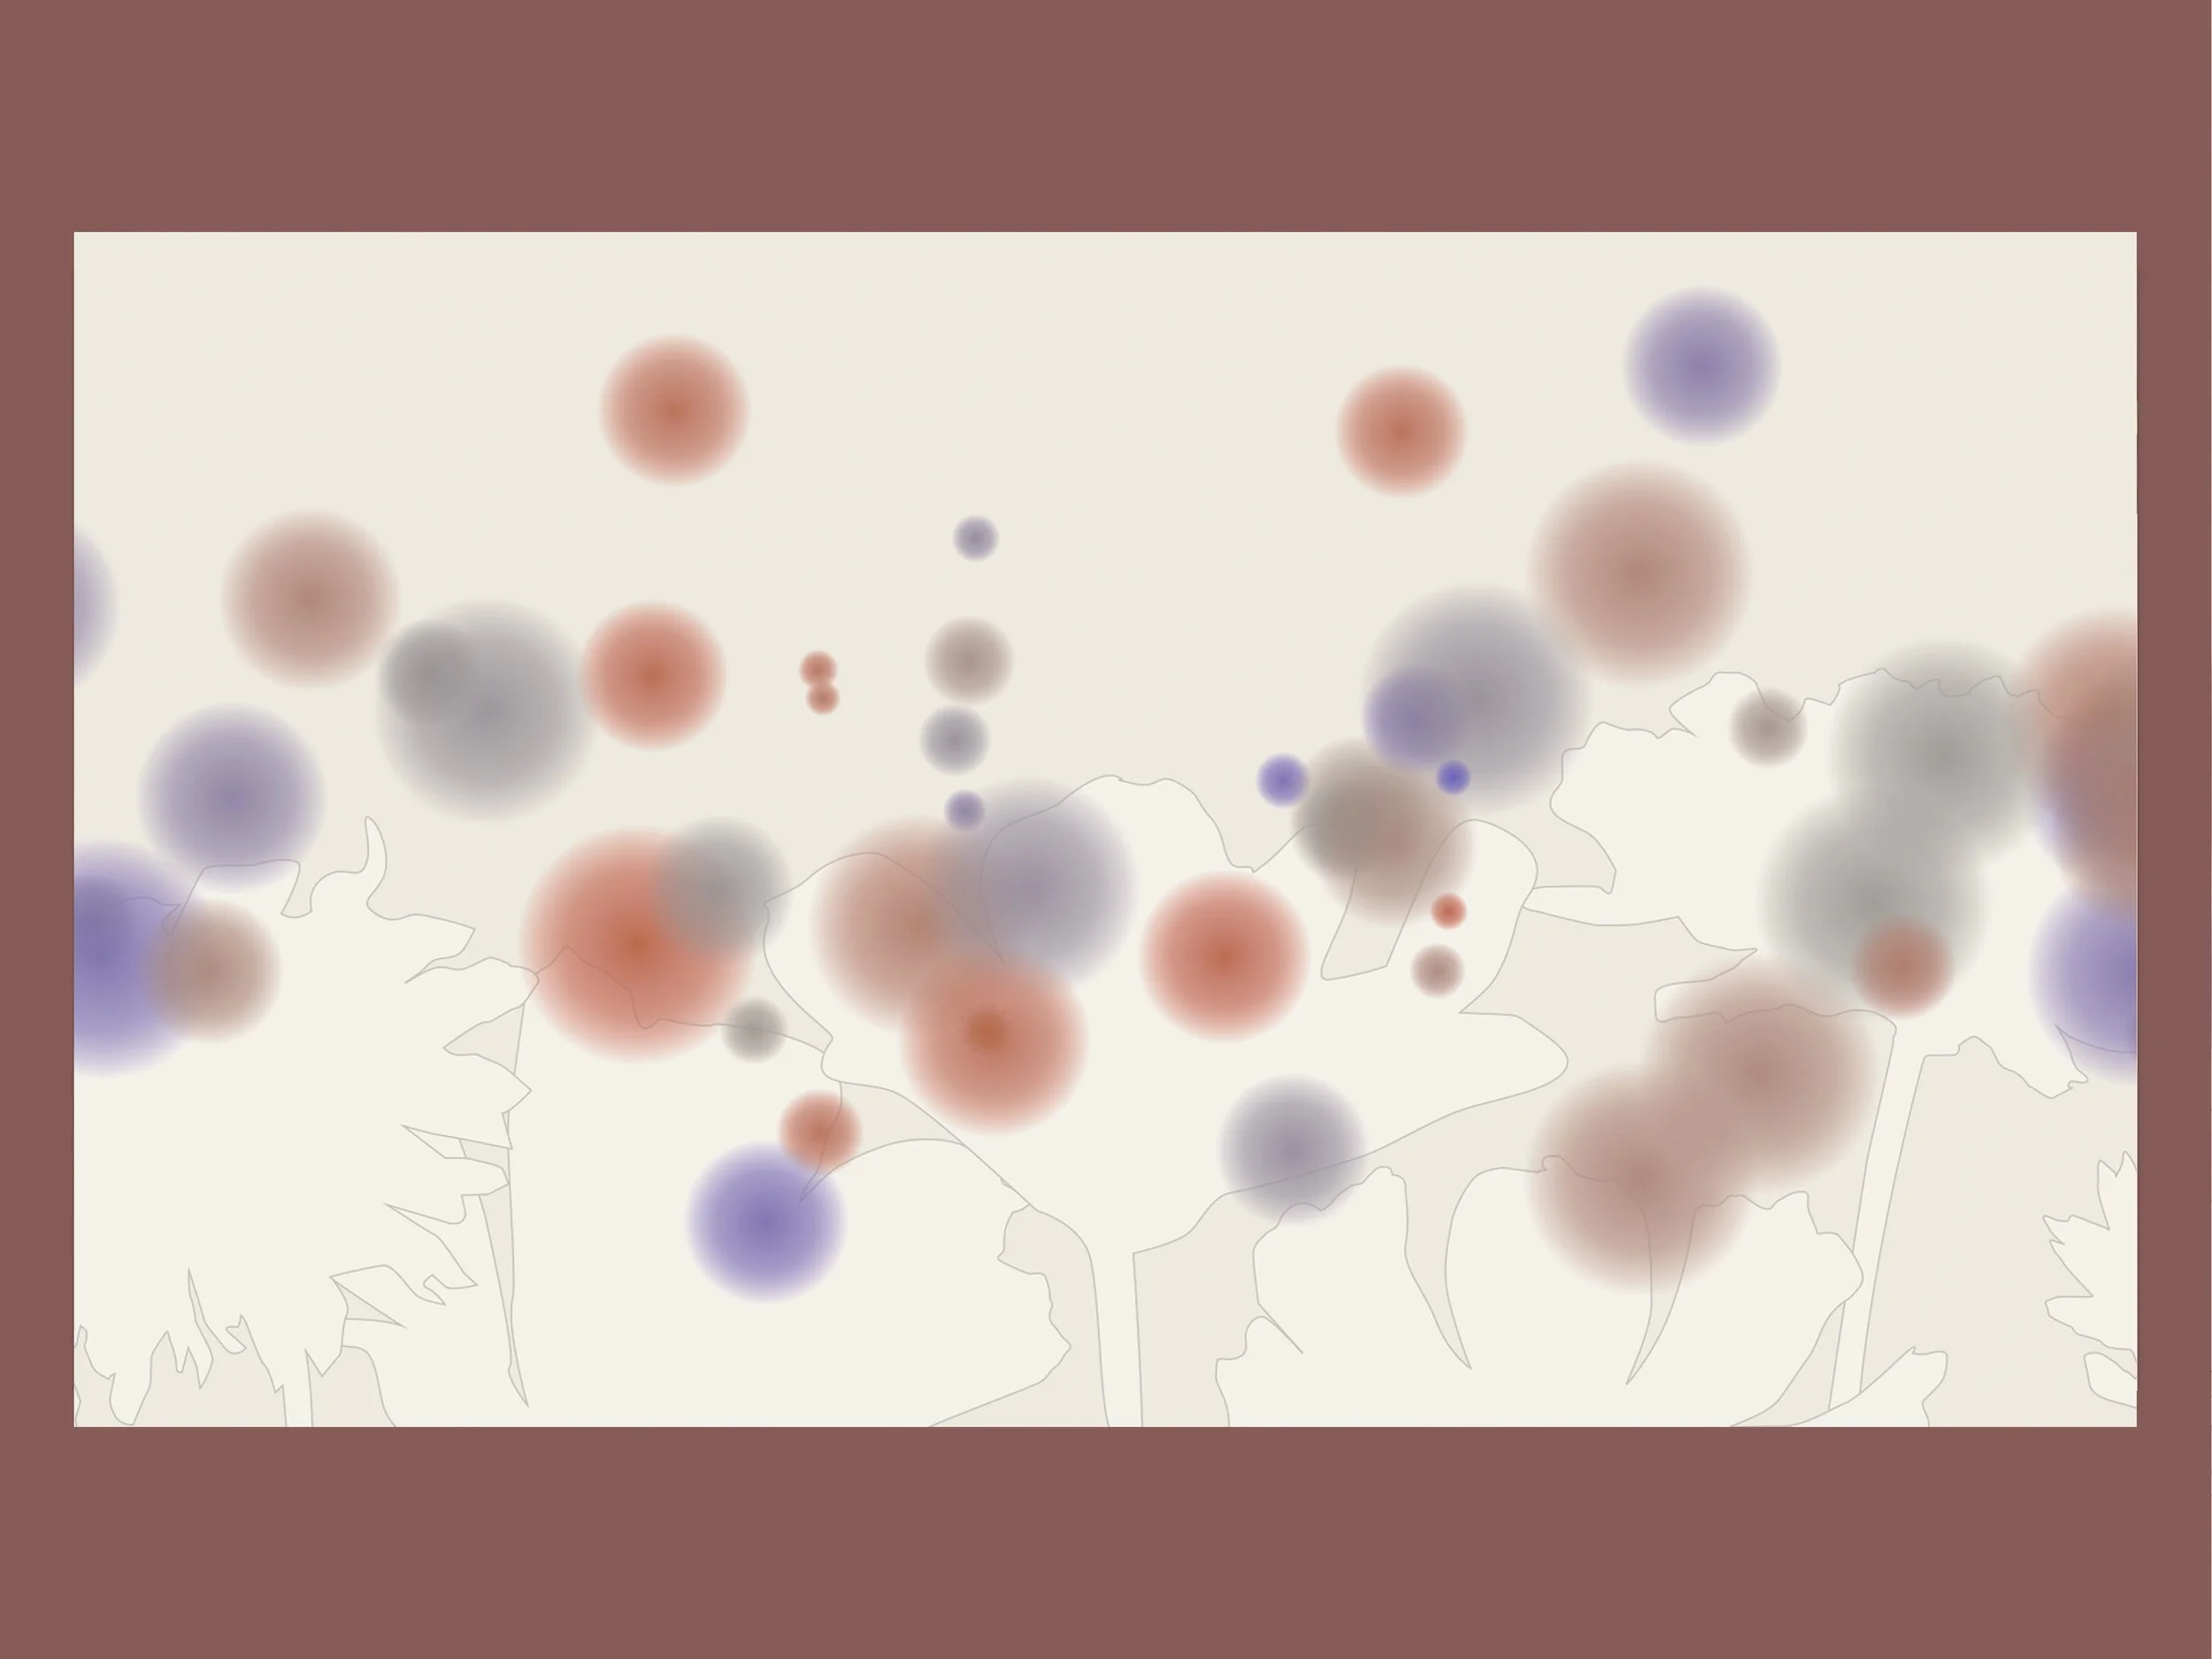
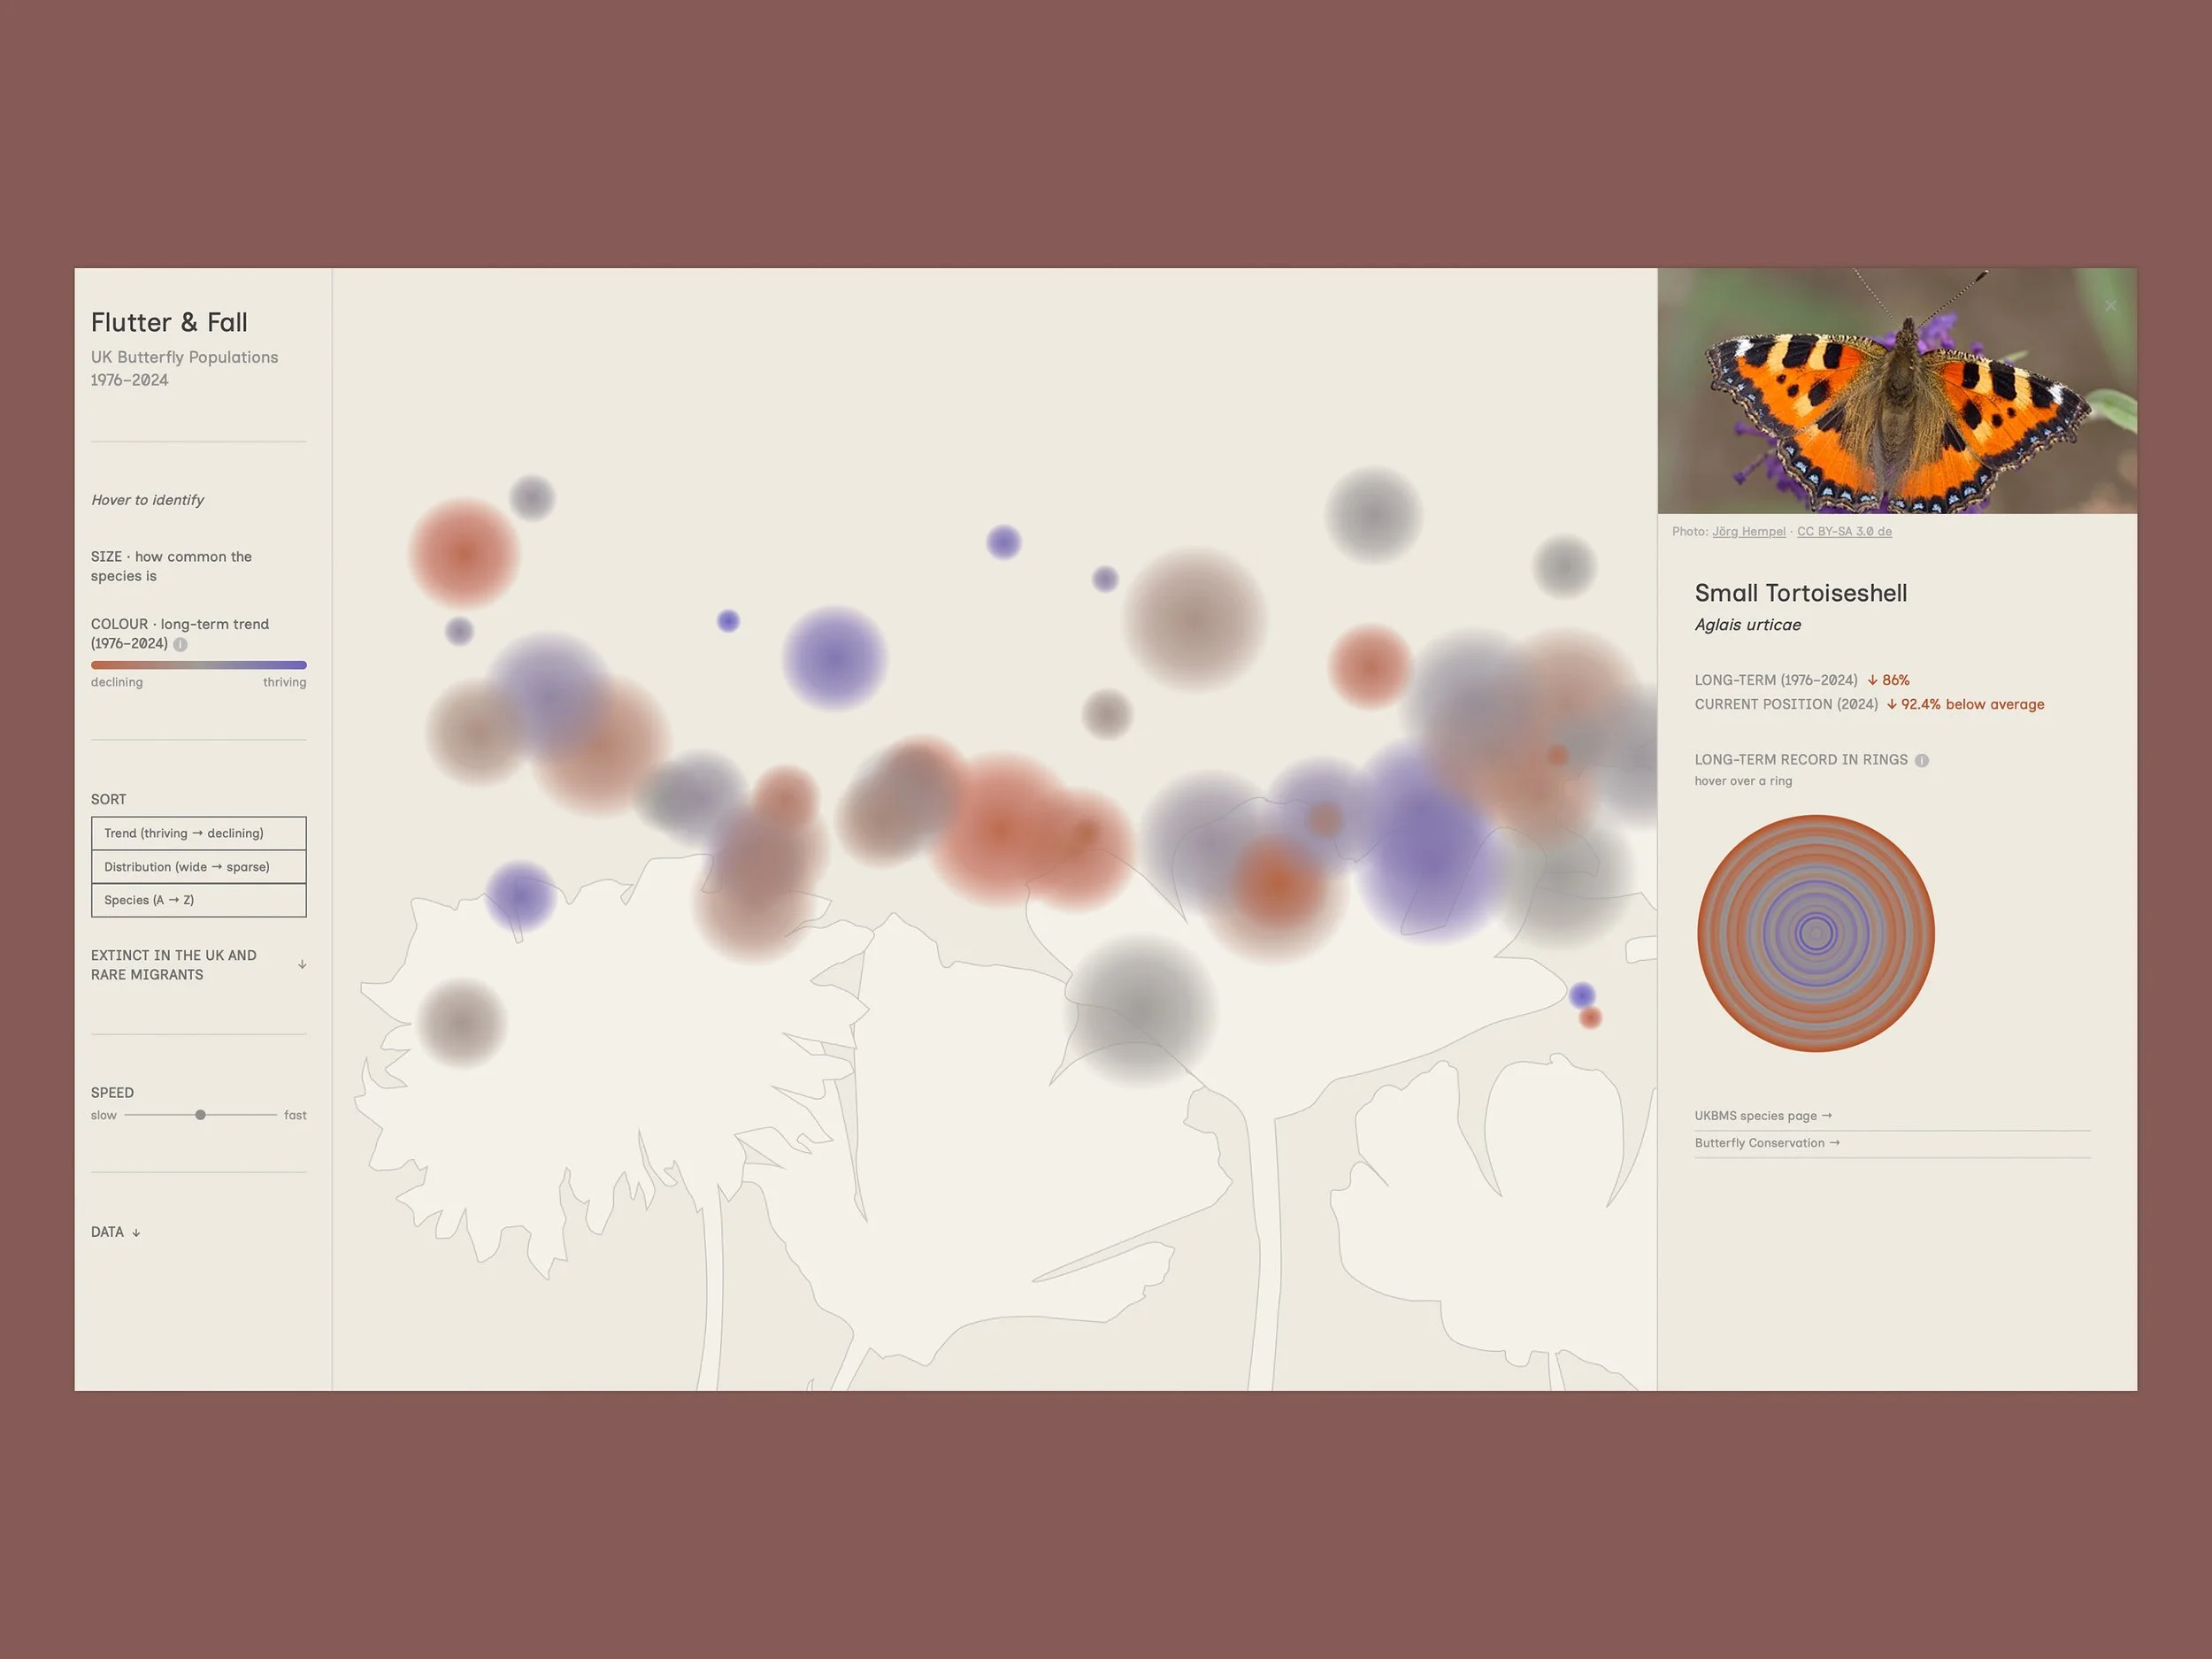
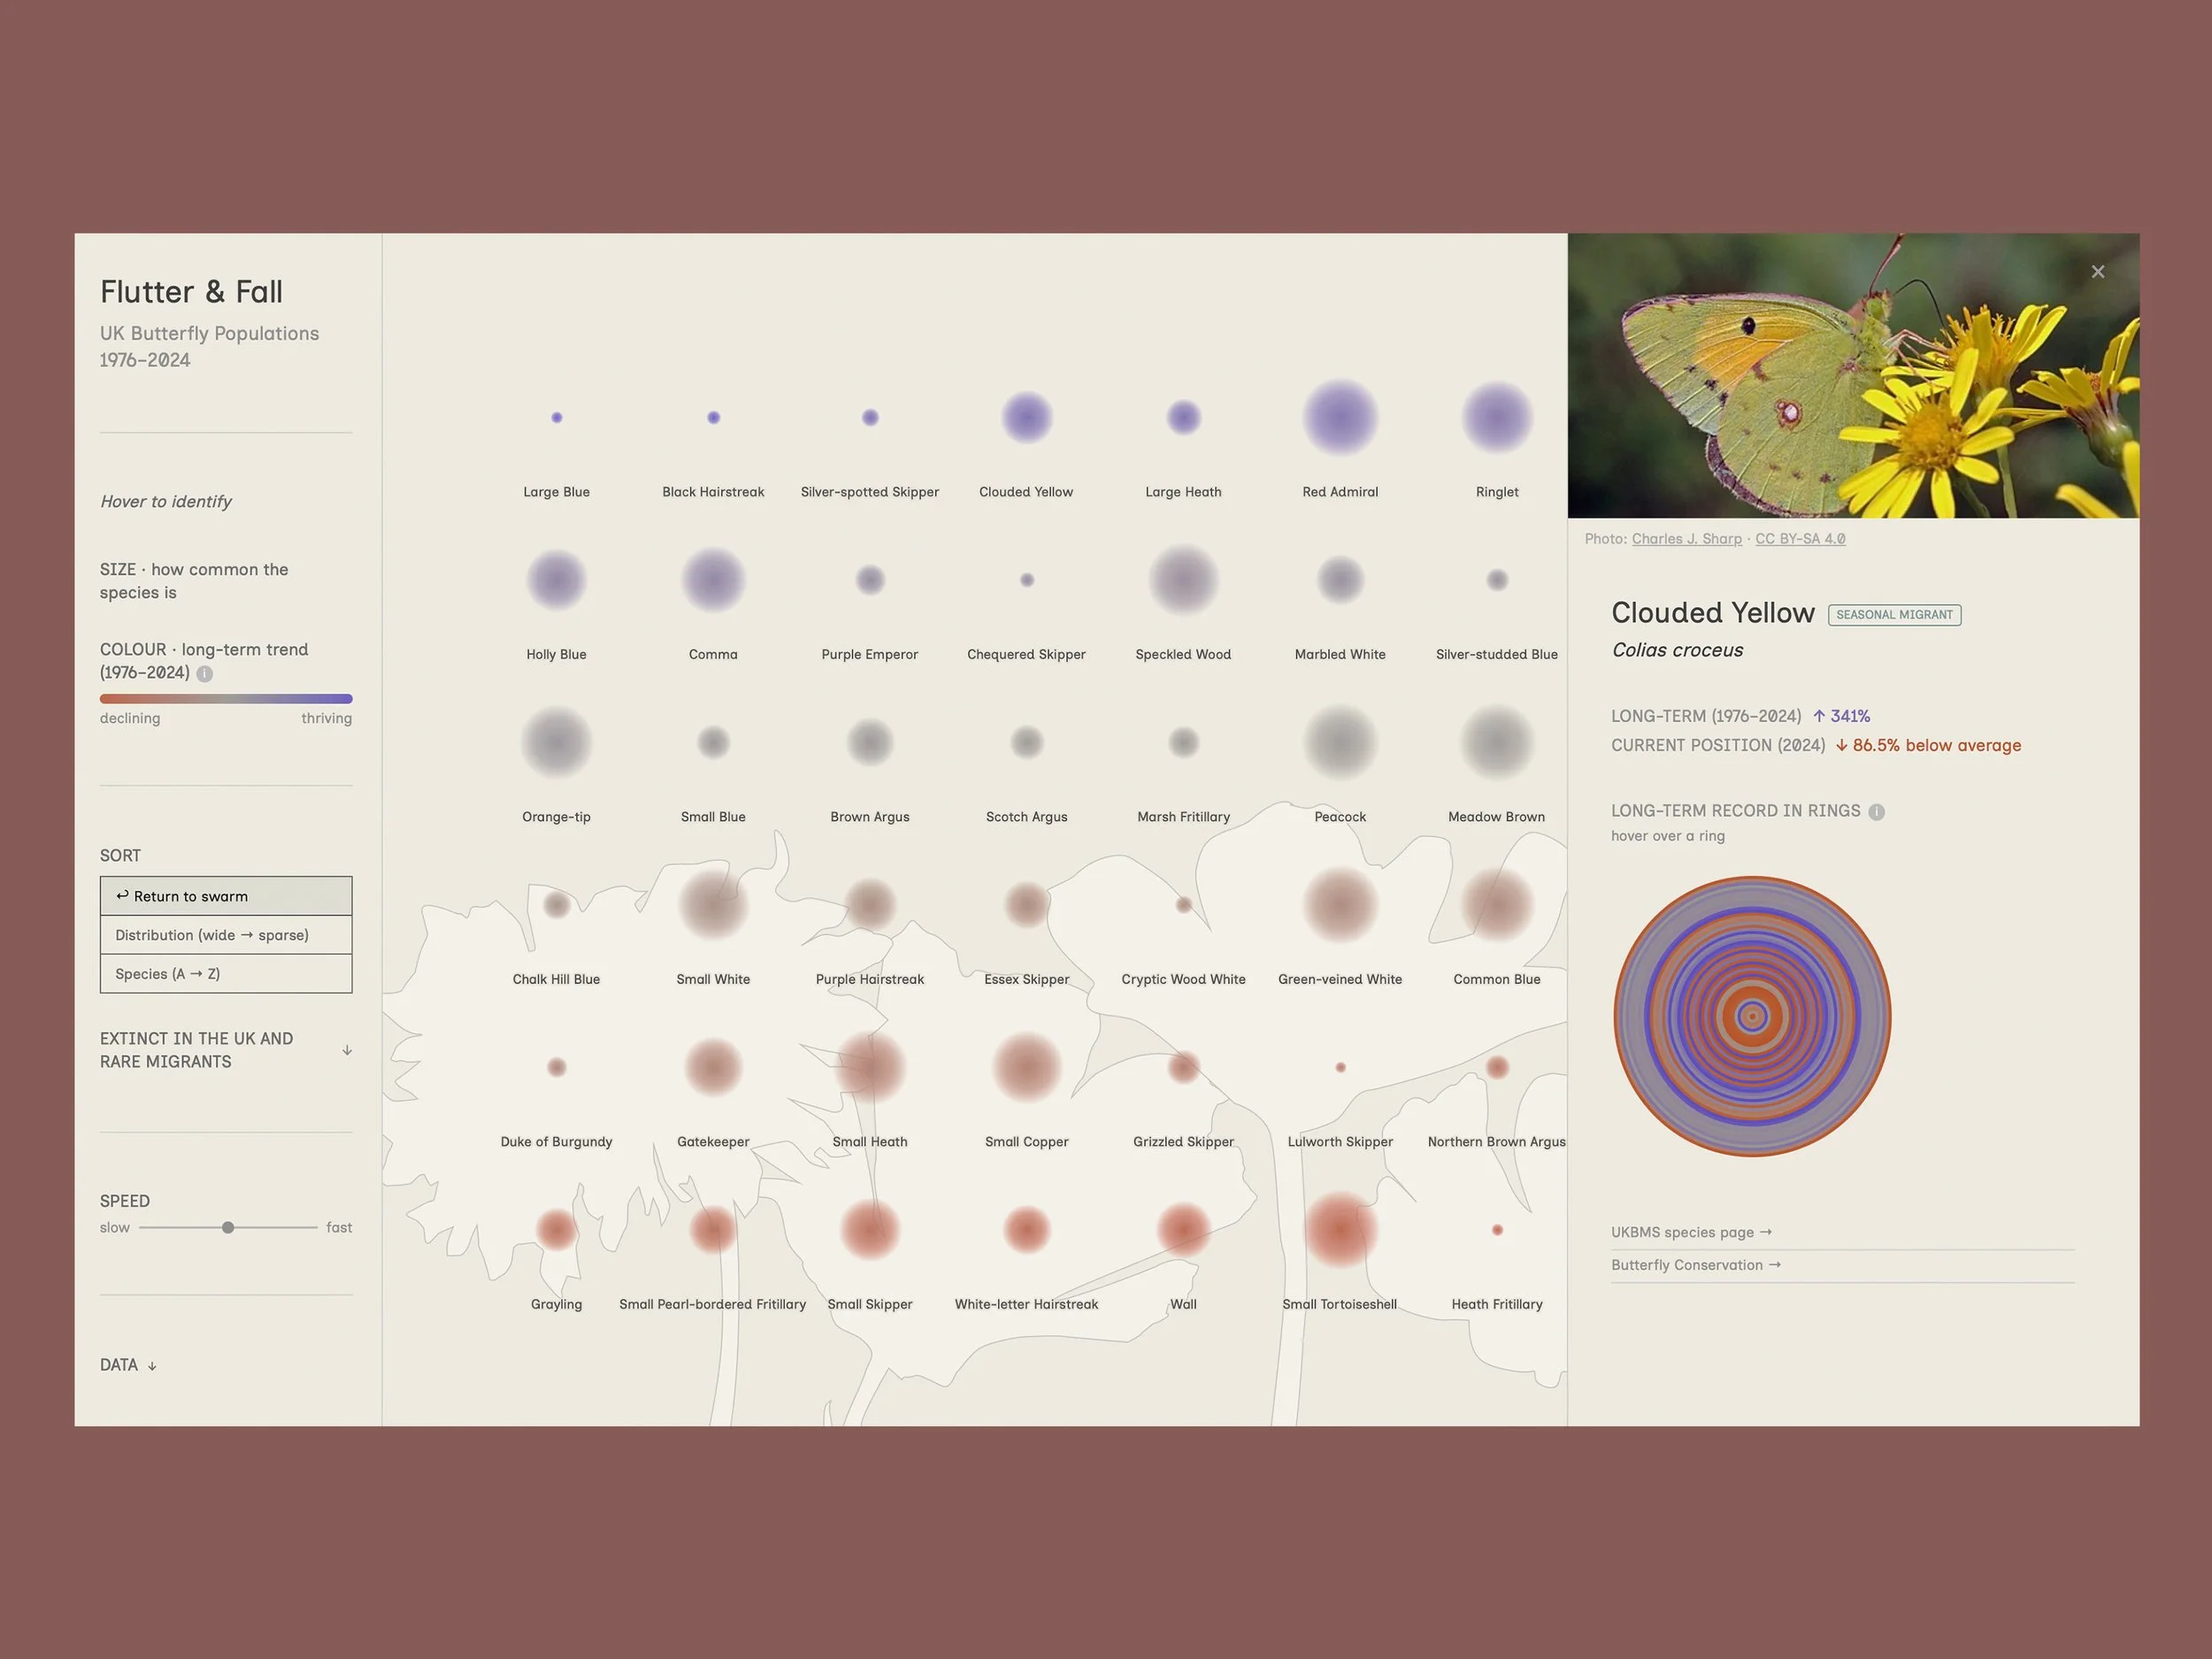
Each of the 60 resident UK butterfly species is represented as a floating orb. The size of each orb encodes geographic range (the number of 10km grid squares across the UK the species was recorded in), communicating relative commonness or rarity at a glance. The orb colour encodes long-term population trend on a continuous scale from deep red (decline) through a neutral warm grey (stable) to deep blue (increase). The scale has asymmetric caps indicating the that populations can decline to extinction but have no upper limit on recovery.
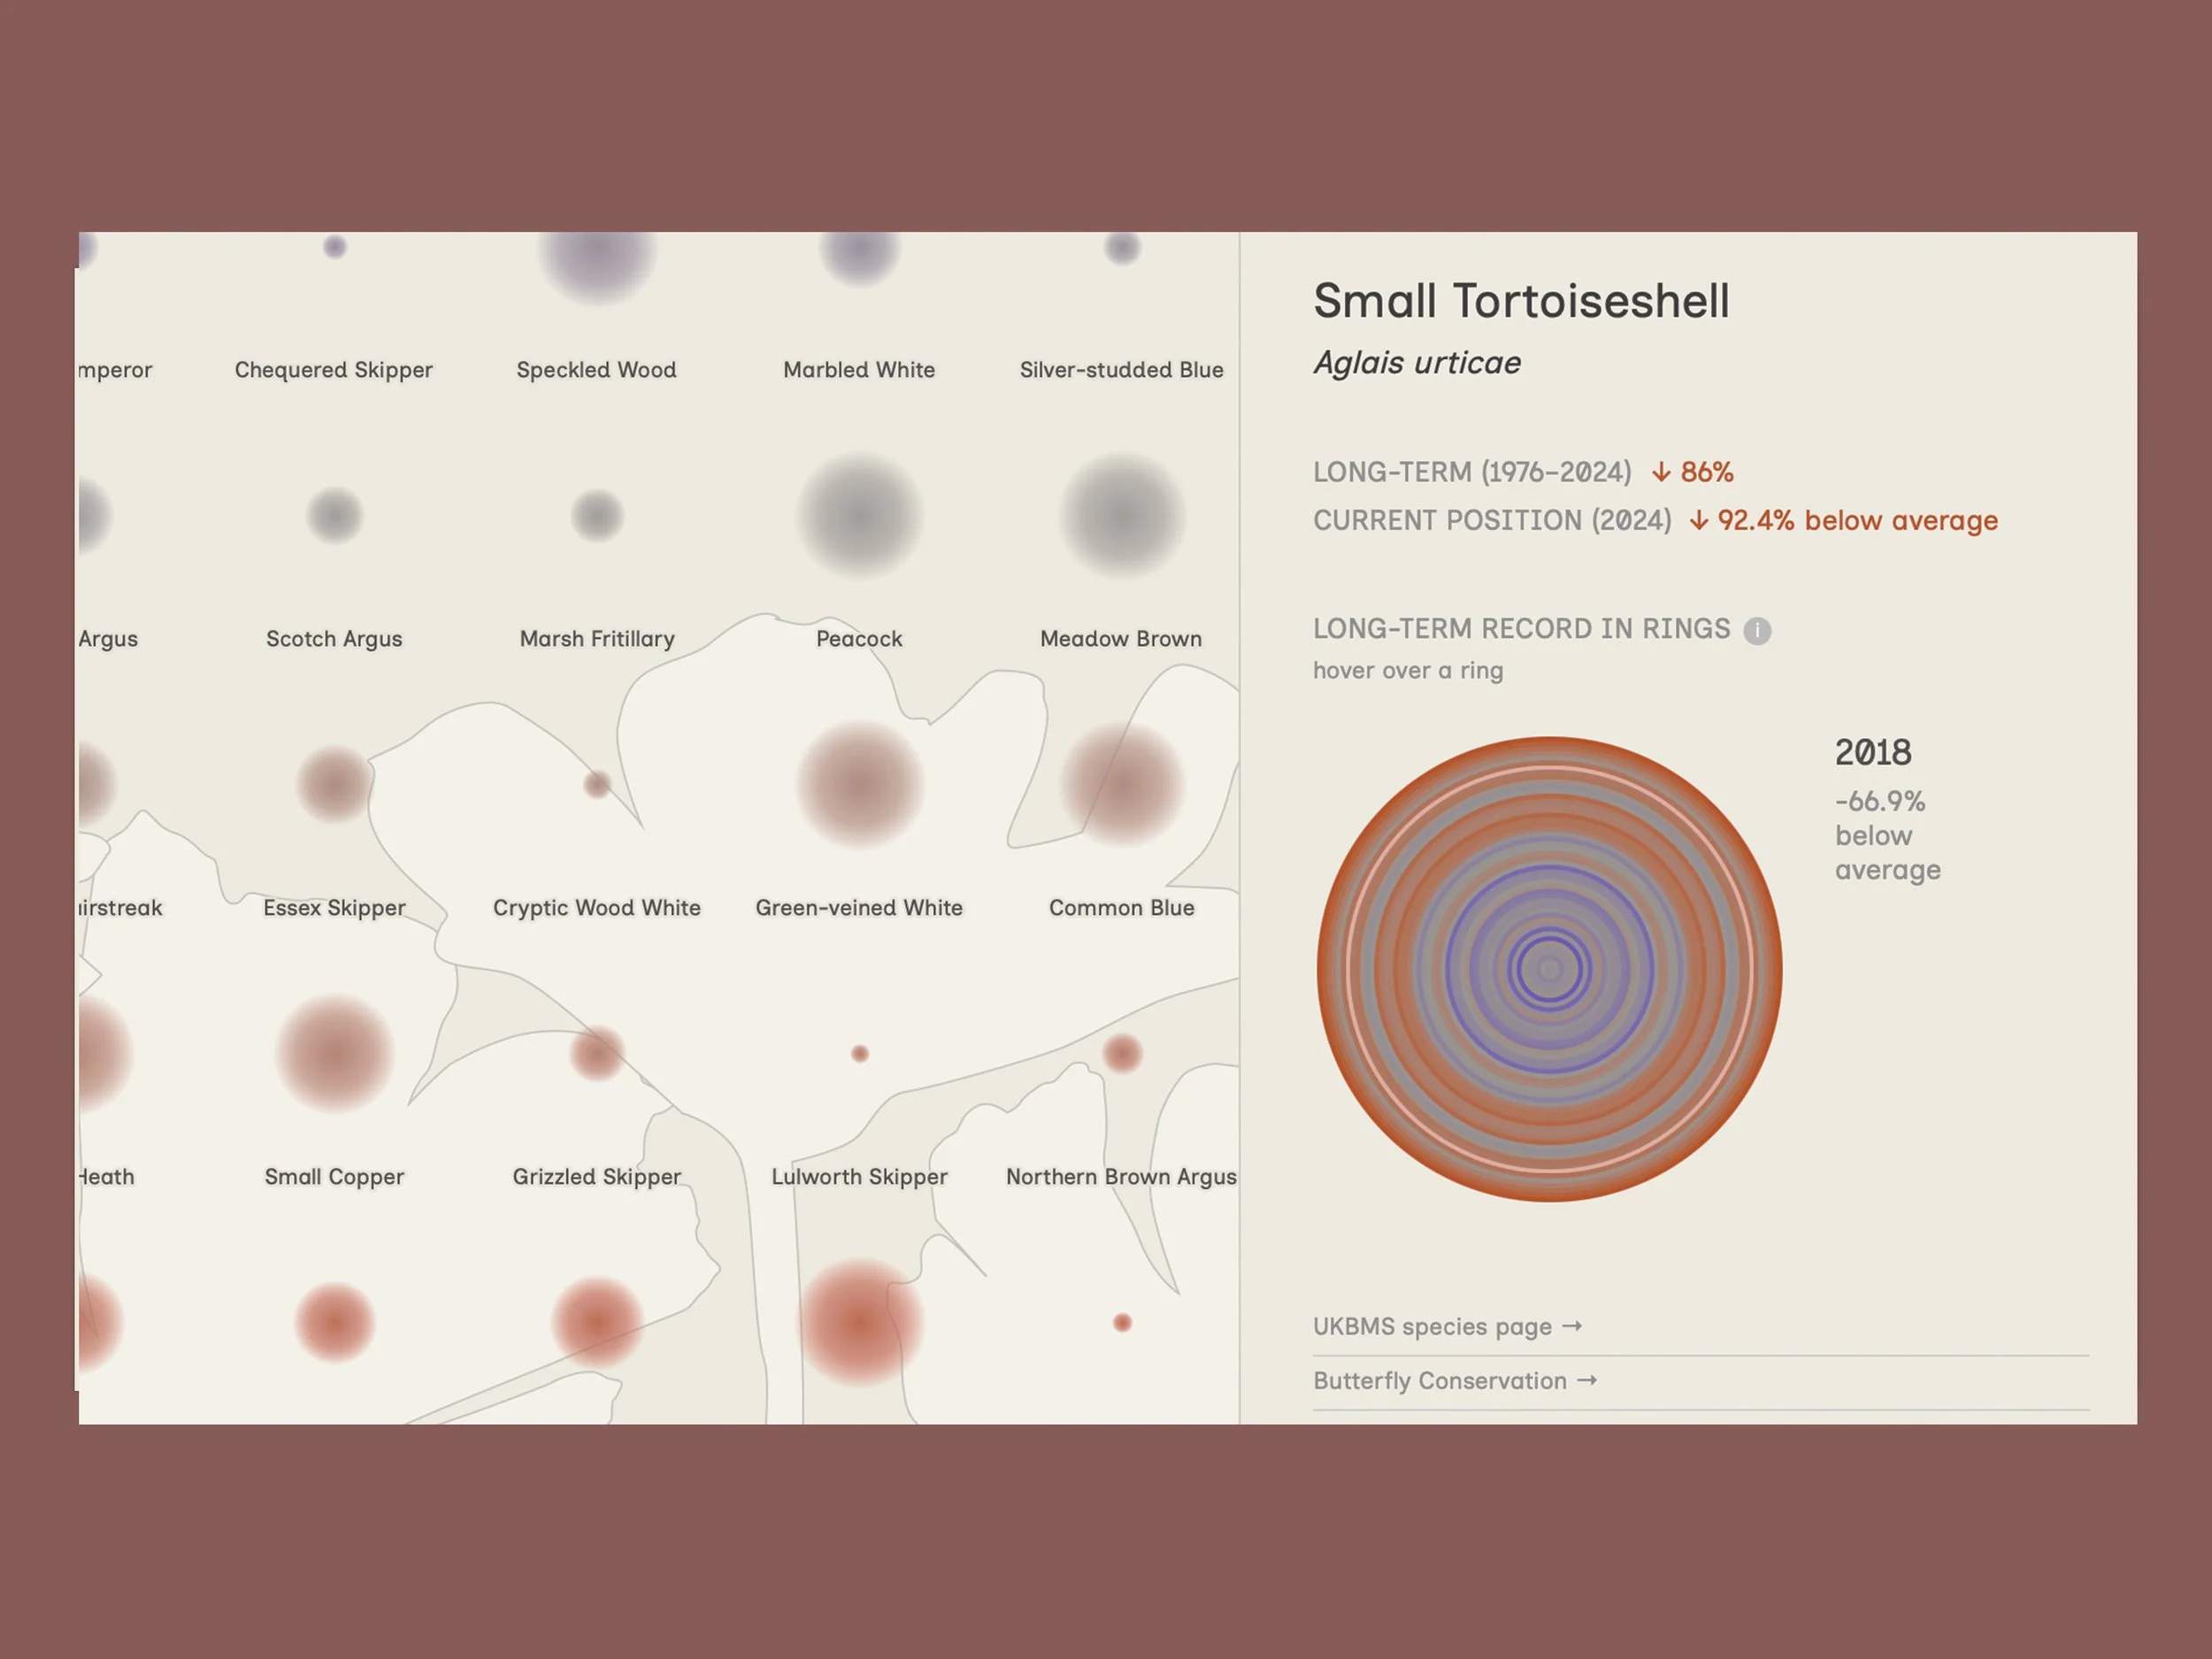
Clicking any species opens a detail panel showing its annual population record as concentric rings, each representing one year and coloured by how that year compared to the species' own long-term average.
Data:
GBIF.org (2026). GBIF Occurrence Download. https://doi.org/10.15468/dl.2fhtt
The data was pre-processed and transformed in R. The visualisation was built in D3.js using an AI-assisted ('vibe coded') process.
Visualisation / Data visualisation / Data-informed visual communication