Glebe, Haymarket, Ultimo & Pyrmont: A suburb theory of change
Client
University of Technology Sydney, Centre for Social Justice and Inclusion
Year
2022–3
Overview:
Developed for the University of Technology Sydney’s Centre for Social Justice and Inclusion, this project visualised place-based socio-demographic data as a suite of visual evidence for presentation and reporting.
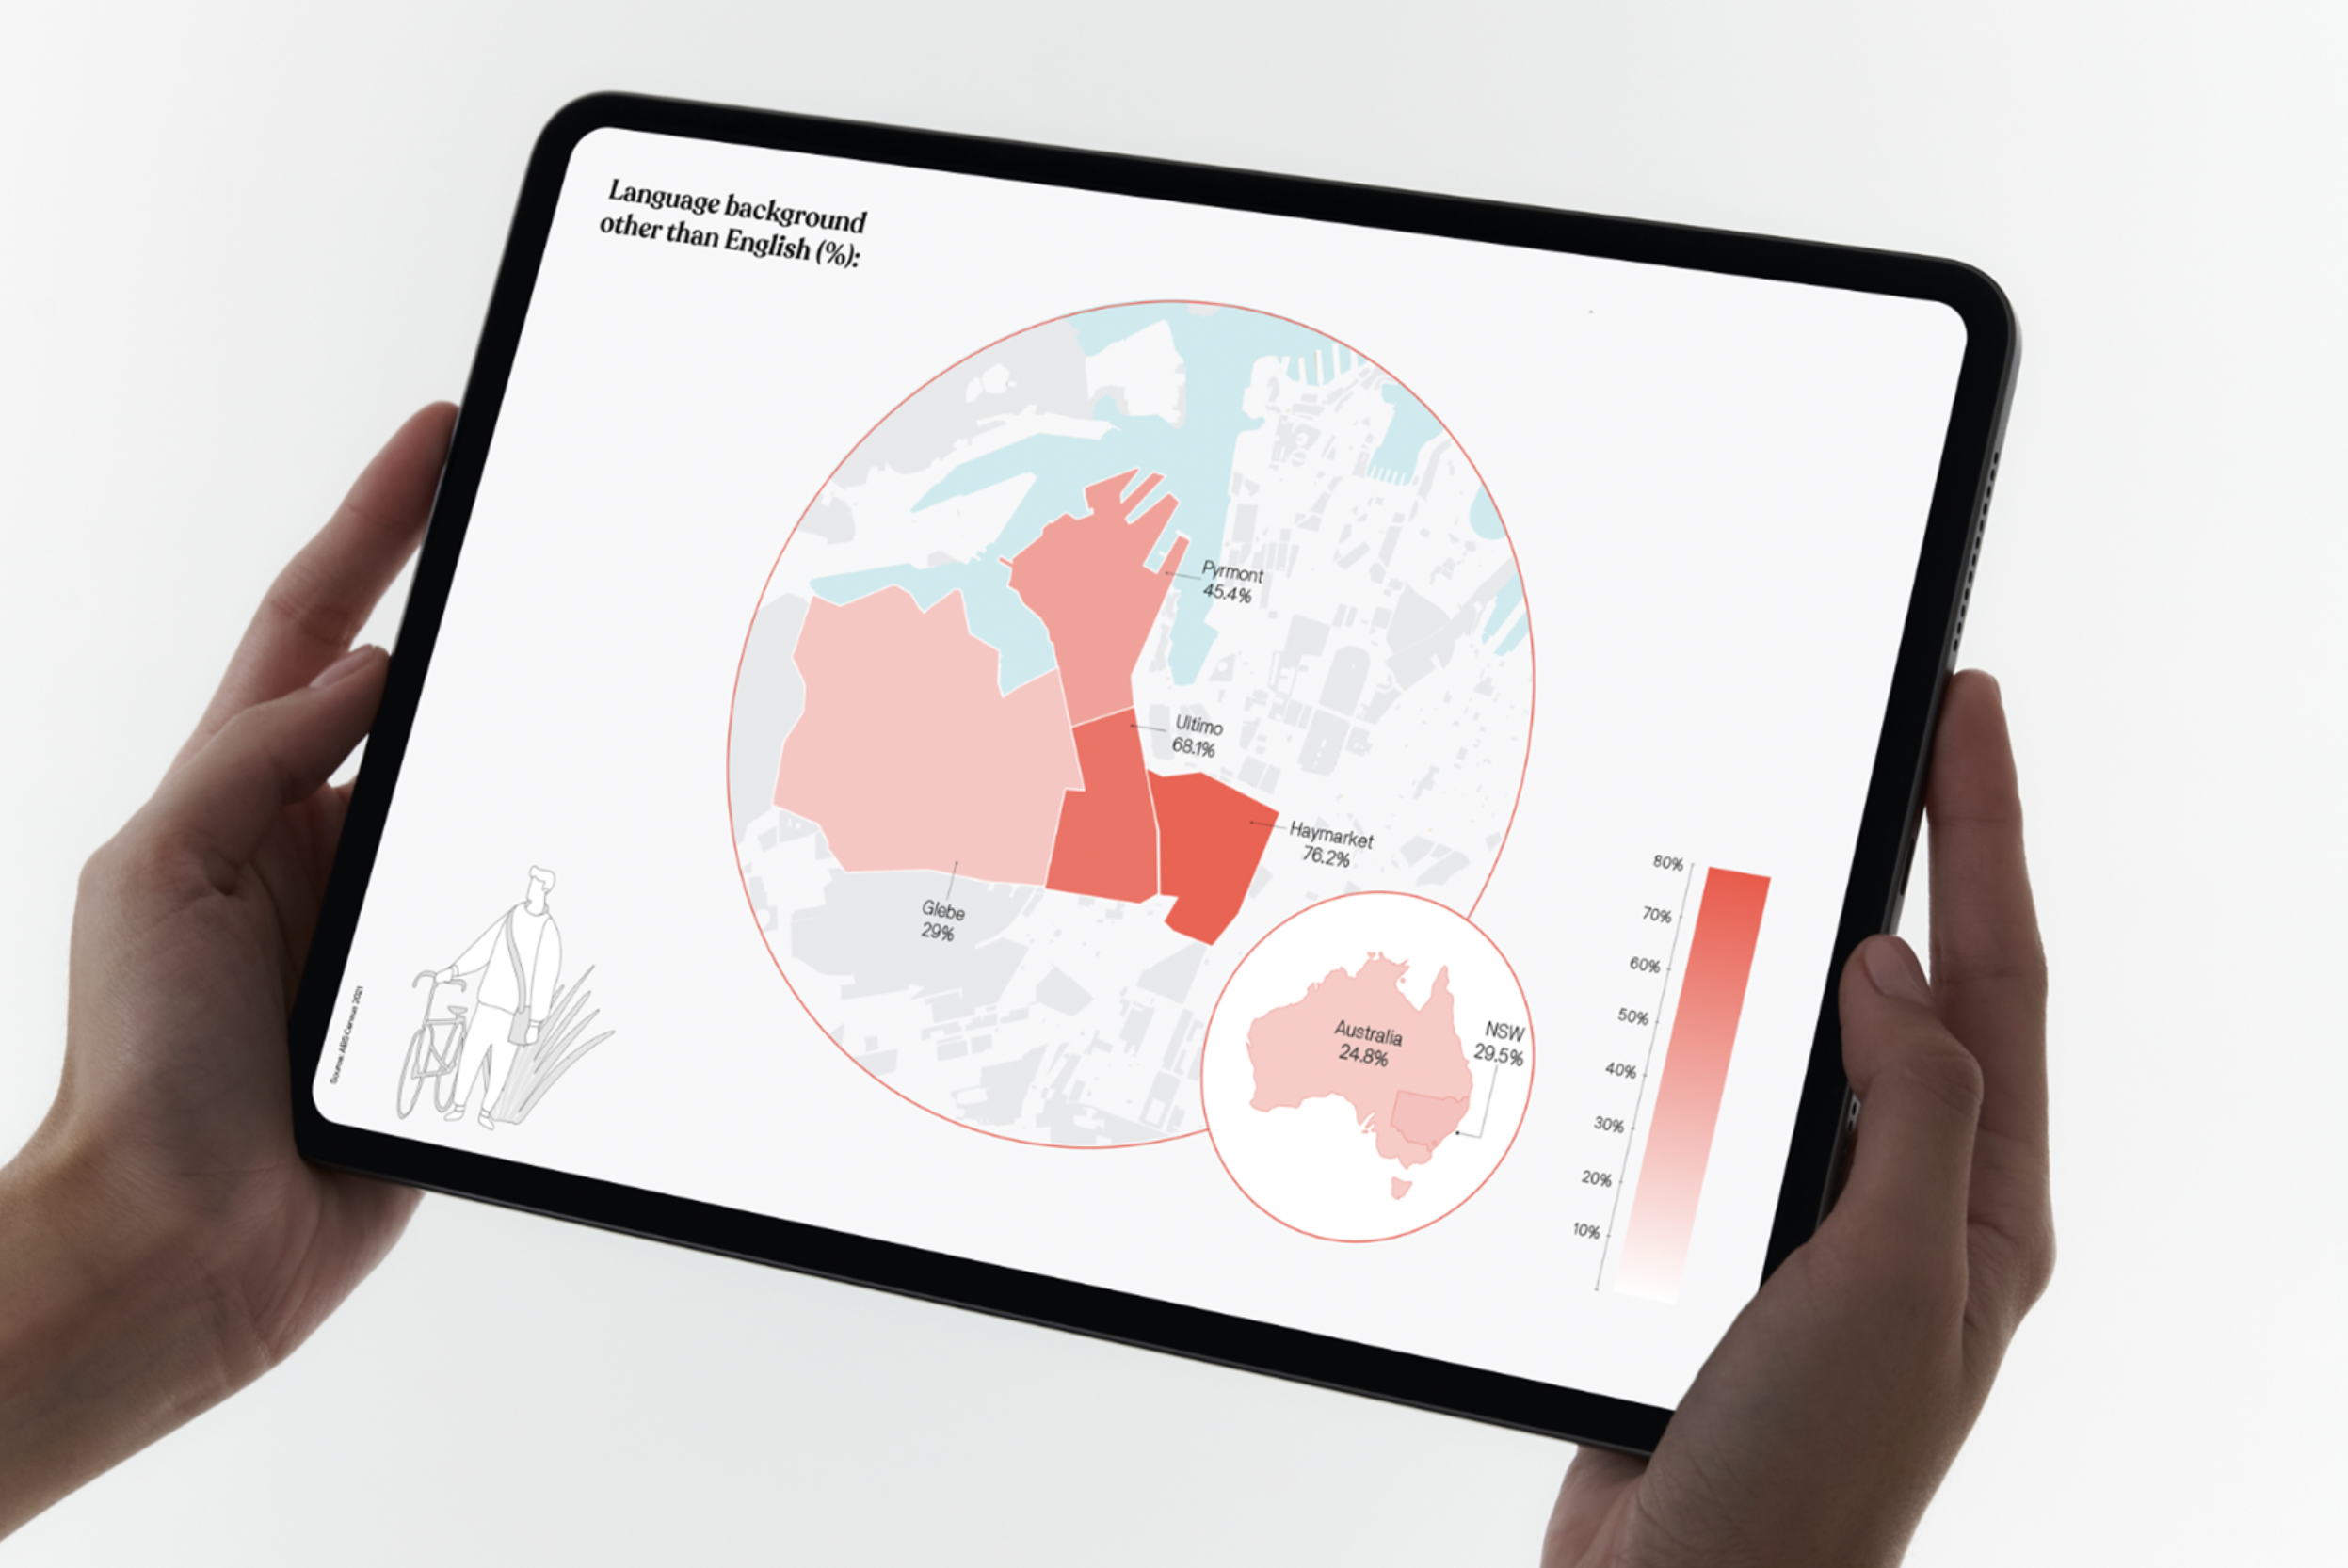
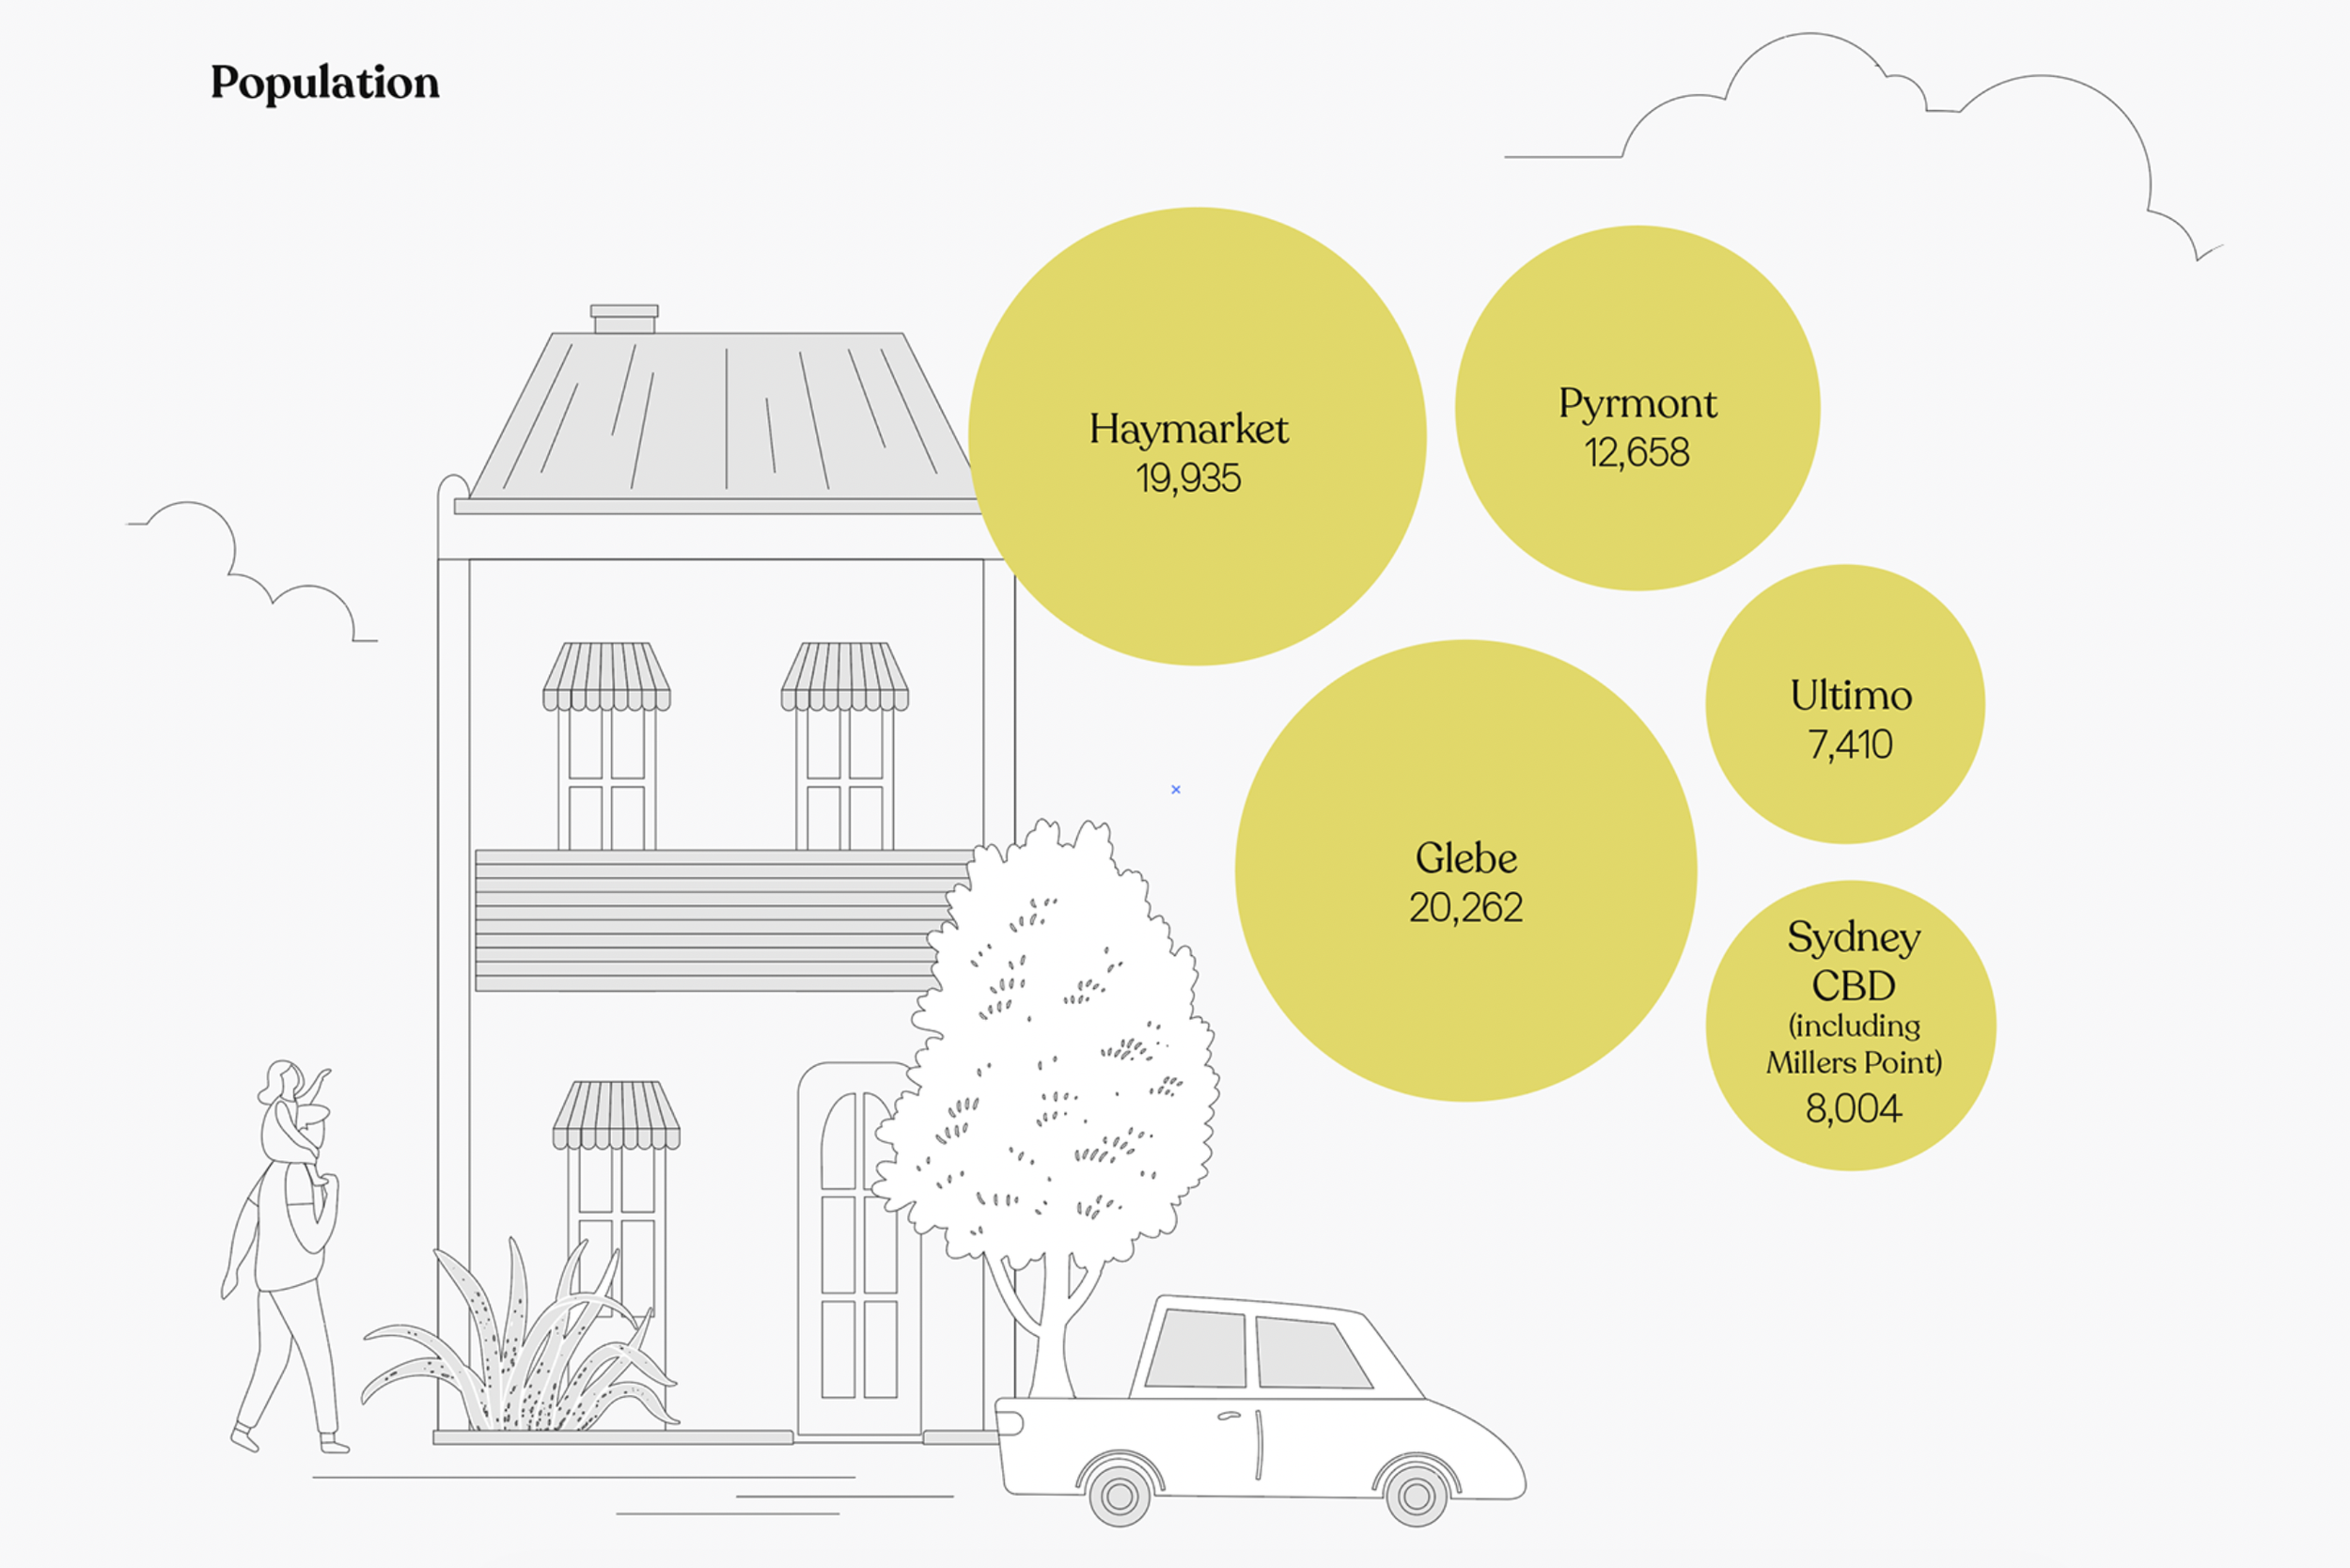
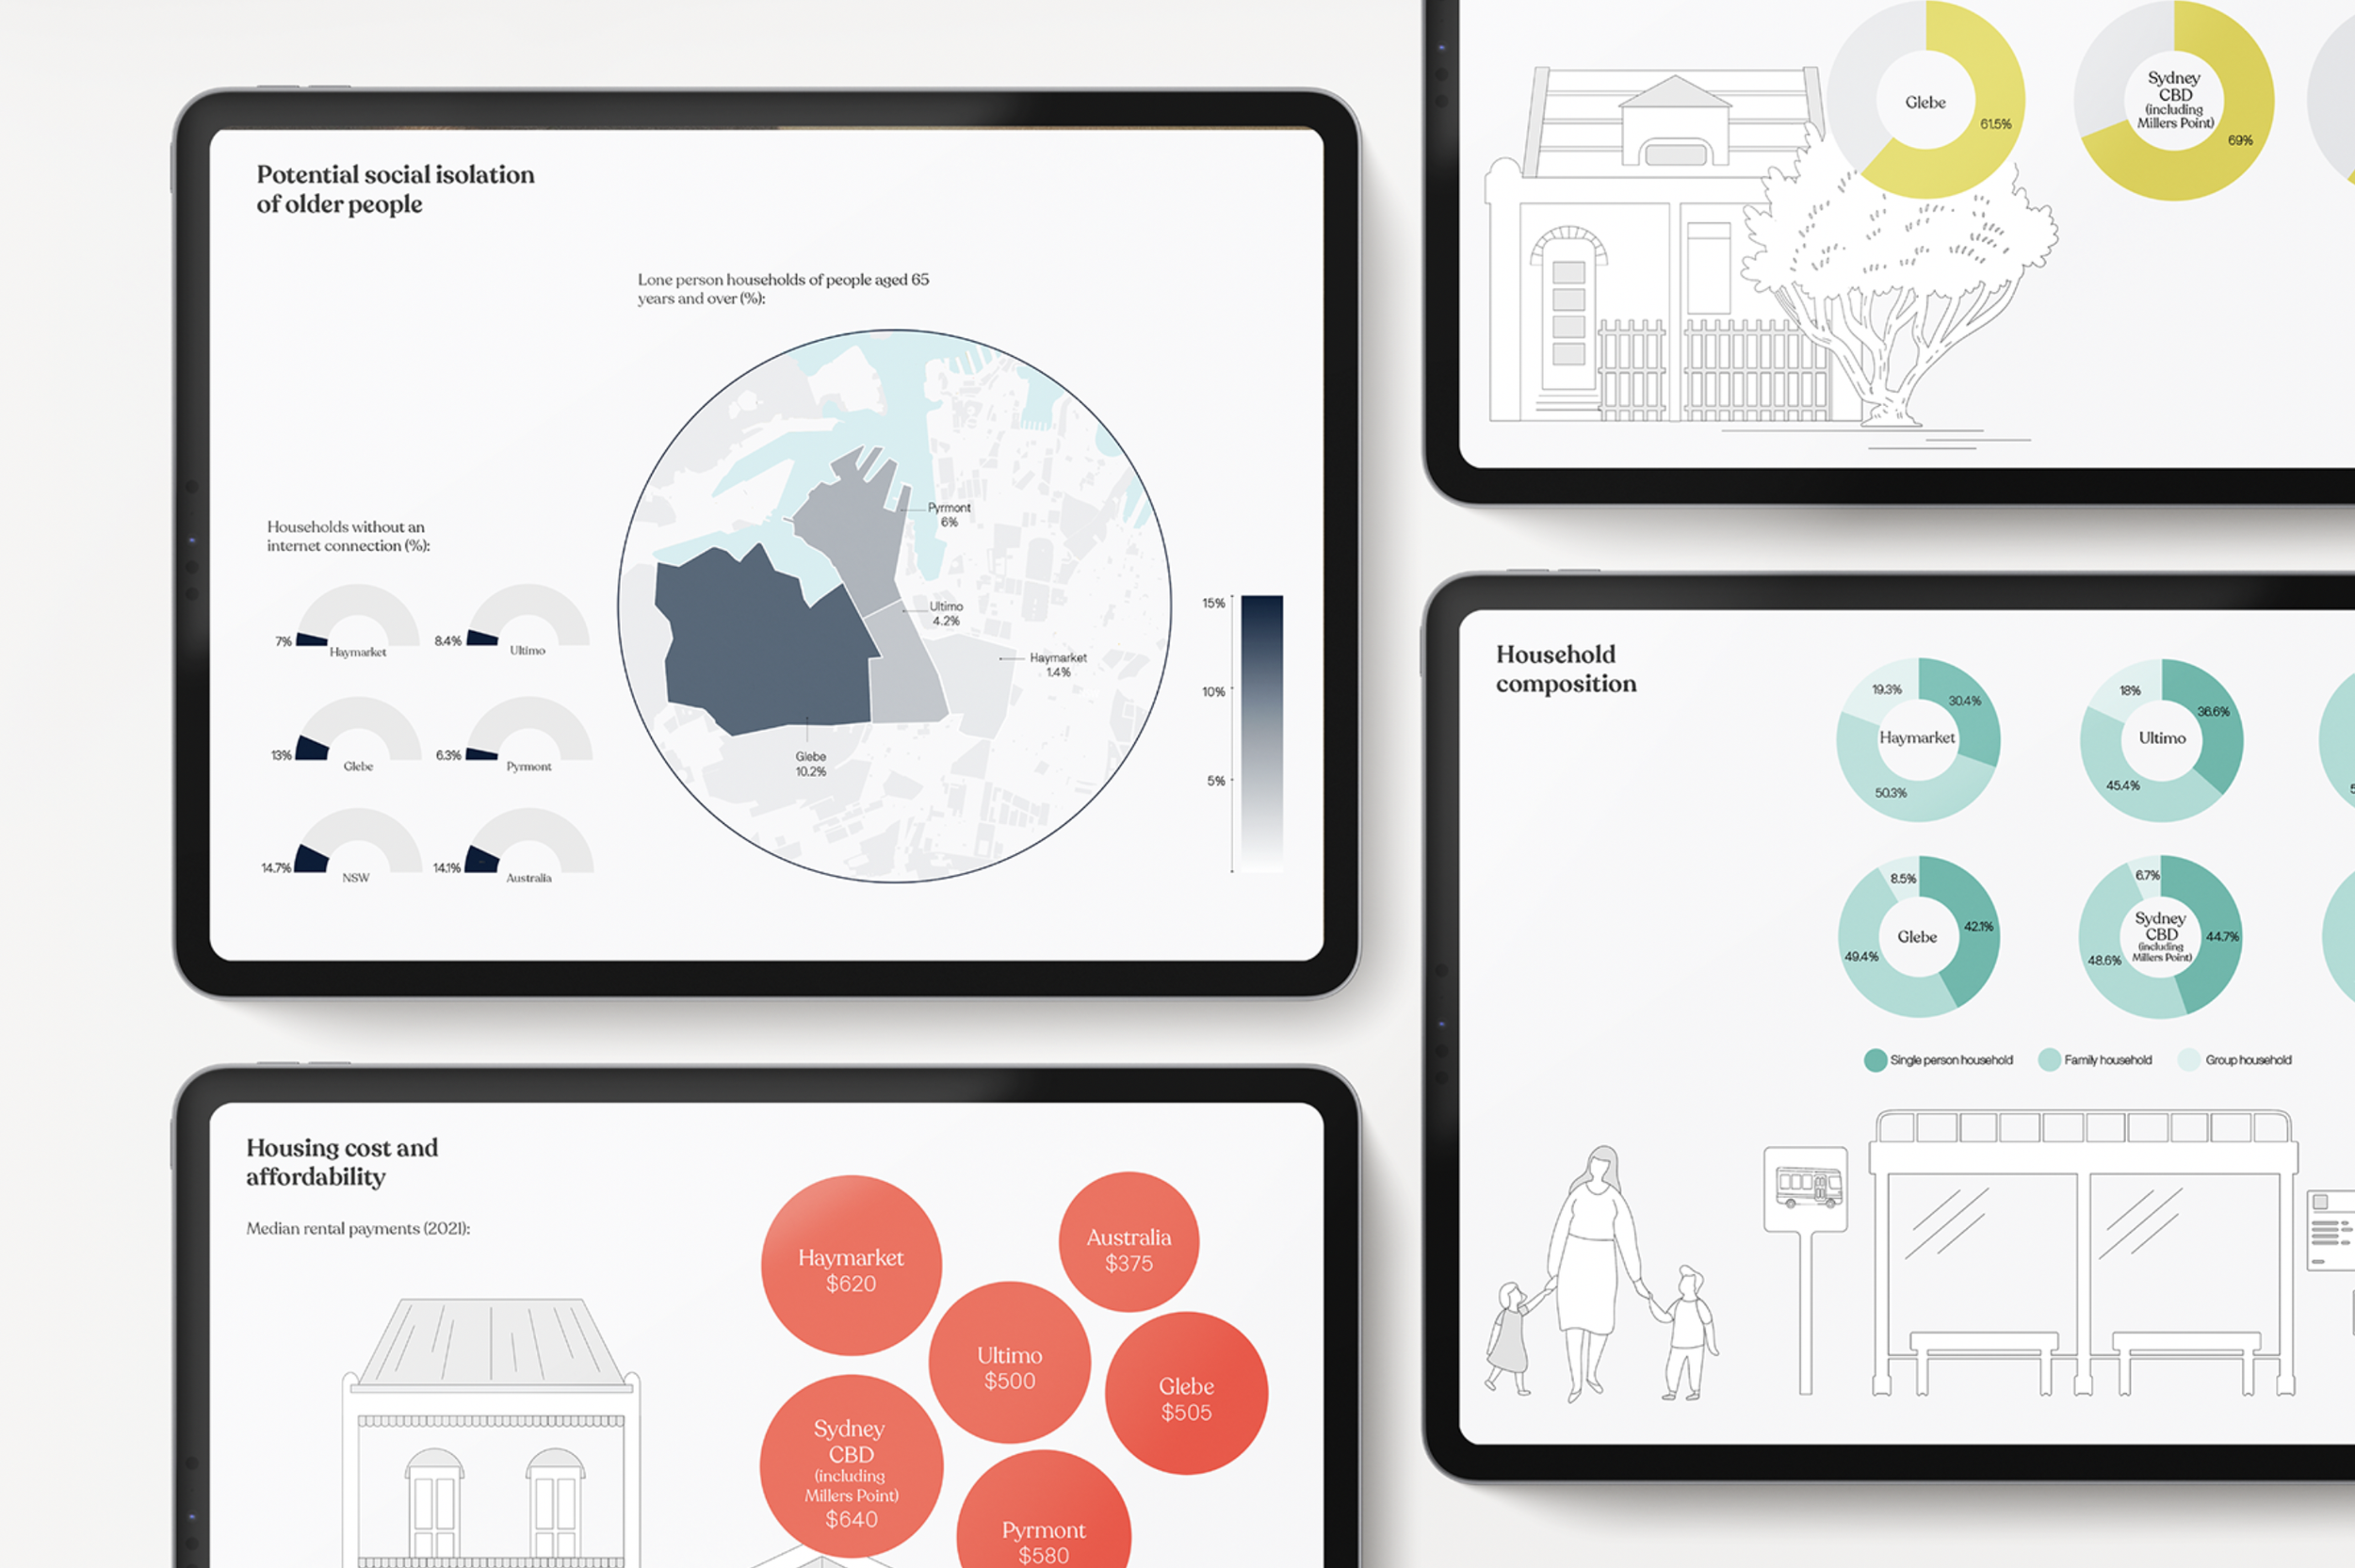
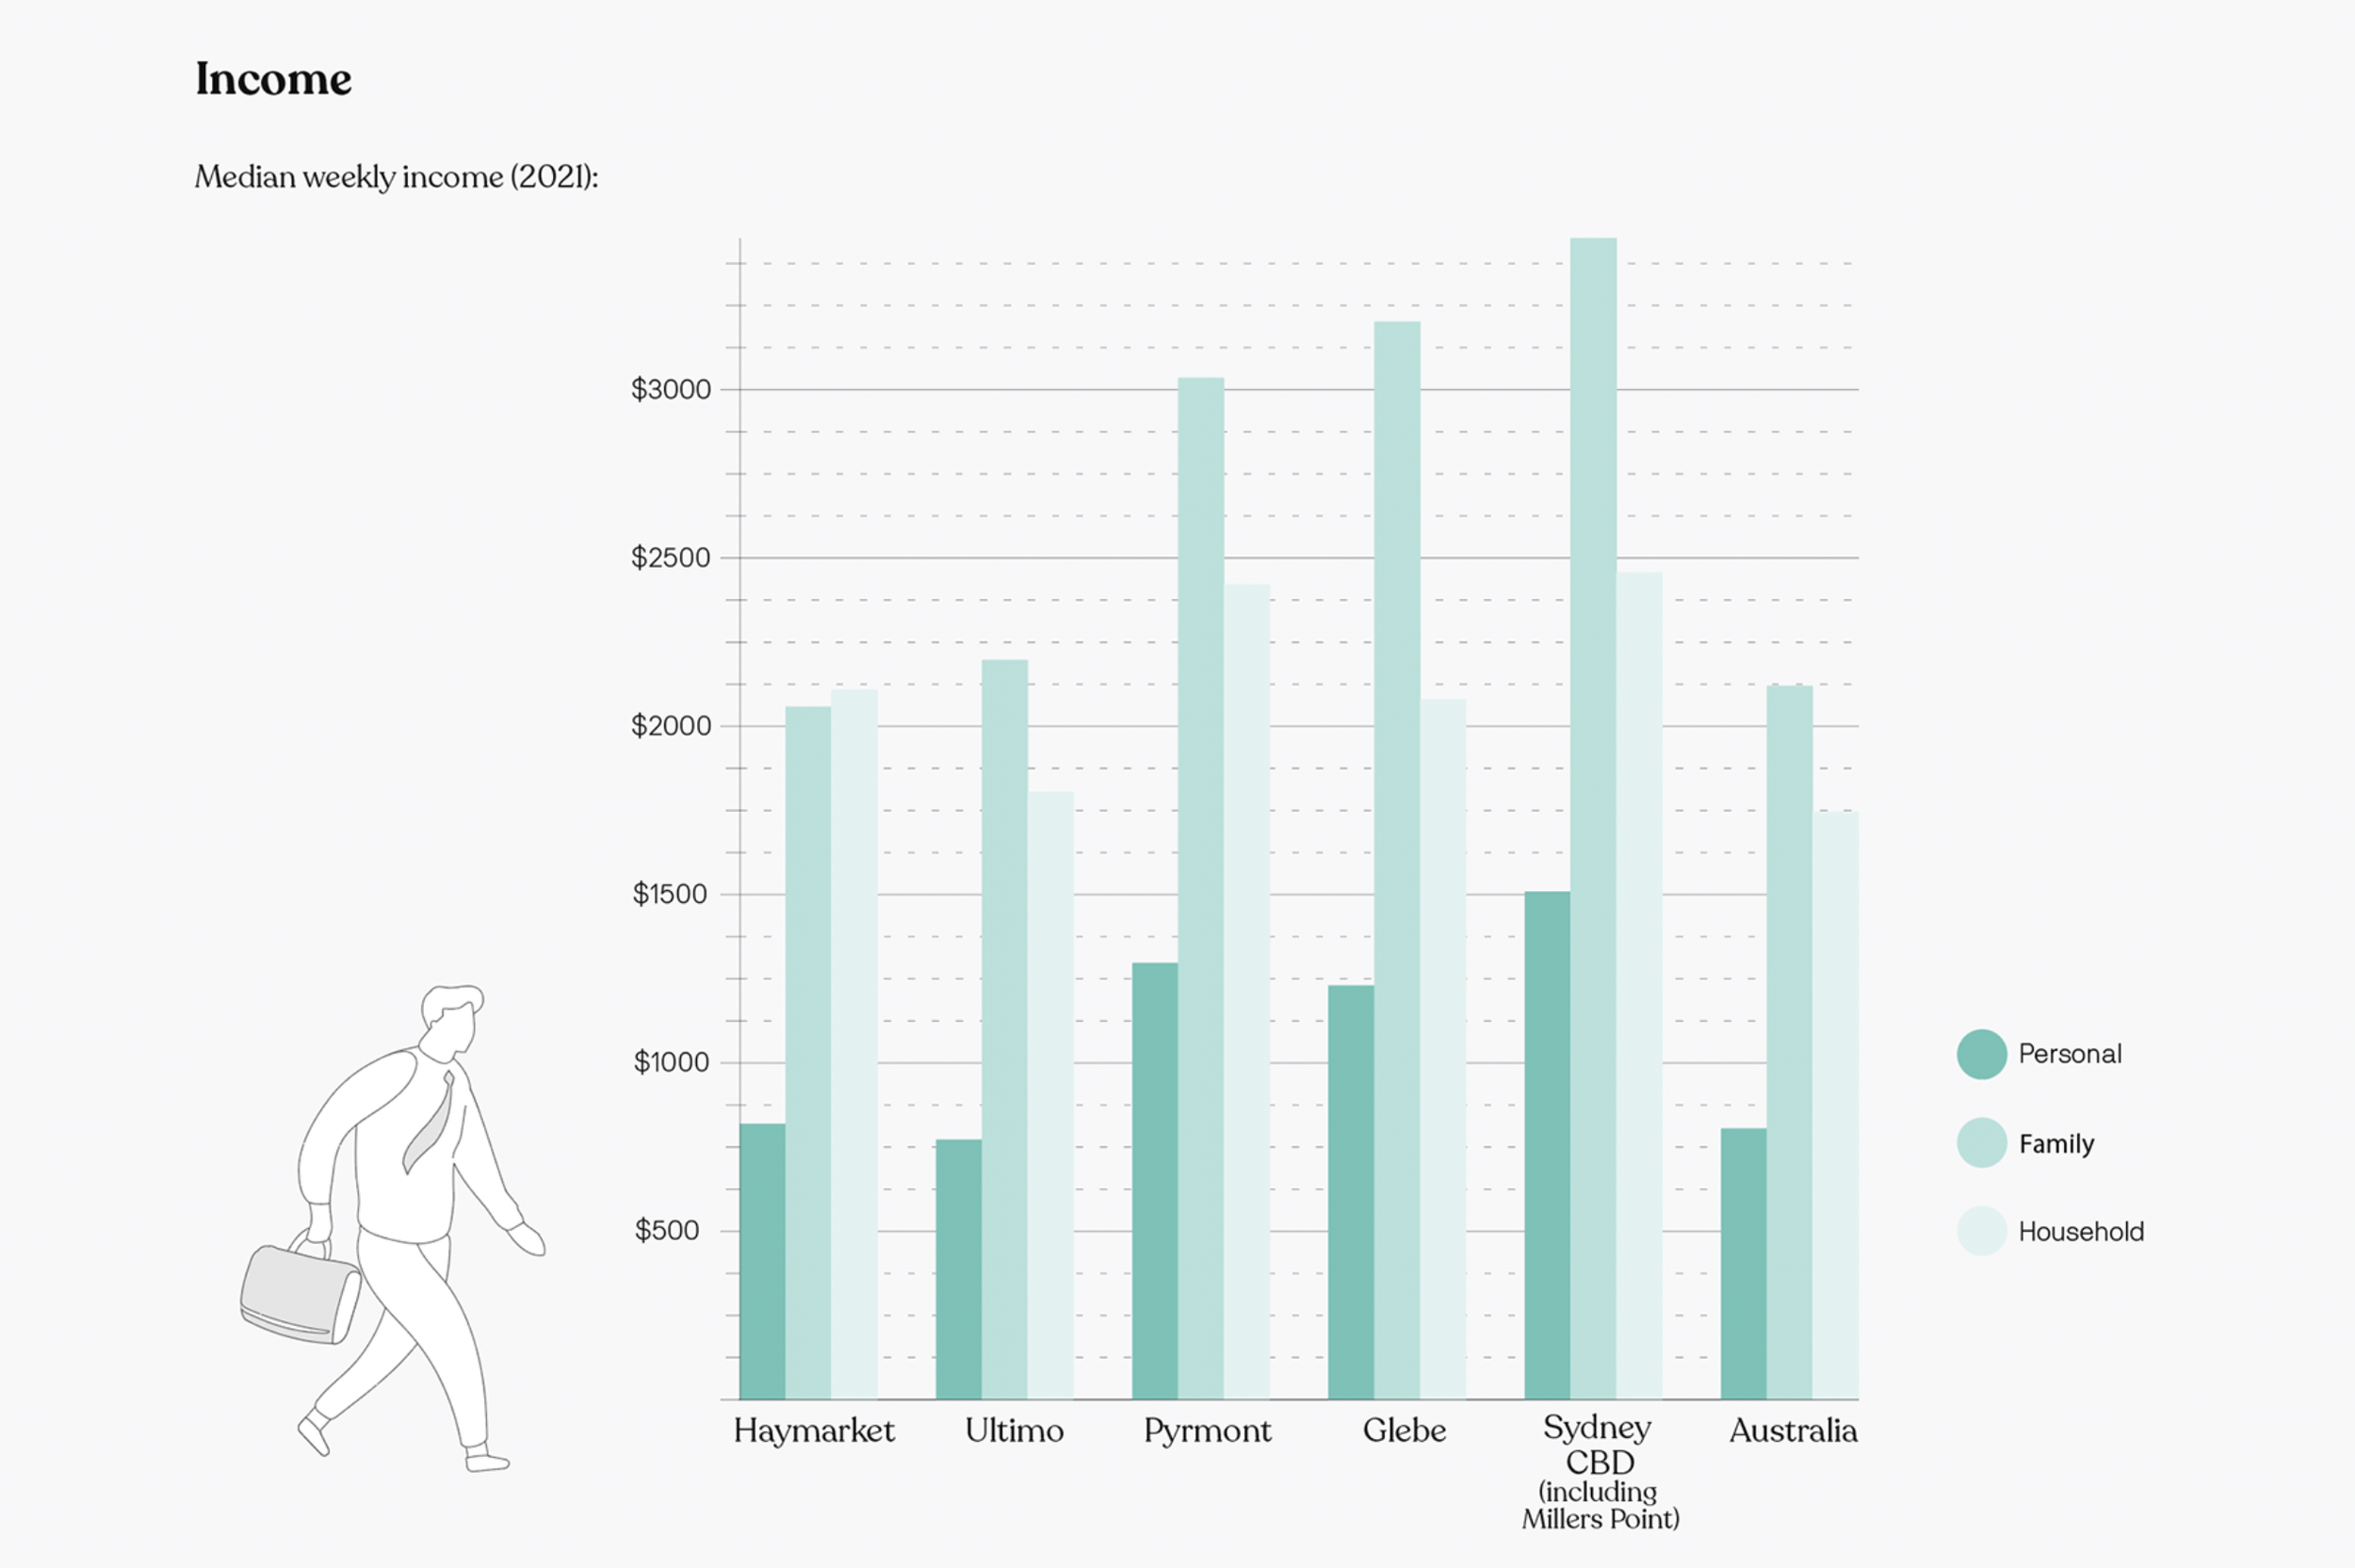
Focusing on the inner Sydney suburbs of Glebe, Ultimo, Pyrmont and Haymarket, the work brought together data on population composition, cultural diversity, income vulnerability and housing stress to support a more nuanced understanding of who lives in the precinct and how social indicators intersect across neighbourhoods.
Challenge:
The project required translating socio-demographic data into forms that could support both analysis and communication across a diverse audience, including local community stakeholders.
A key challenge was ensuring that the visualisations did not abstract the data from its context. The work needed to retain a strong sense of place and reflect the specific character of the precinct, while clearly communicating patterns, relationships and disparities across suburbs.
Approach:
Erin developed a visual approach that combined structured socio-demographic data with a strong sense of place: alongside the visualisation of statistical data, the project incorporated illustrated elements that referenced the character of the precinct, including terrace houses distinctive to the area. These details helped situate the data within character of the neighbourhoods and reinforced the place-based focus of the work.
The design emphasised clarity and accessibility with a more contextual and playful visual language, ensuring that the material could function both as analytical evidence and as a meaningful representation of the communities of Glebe, Ultimo, Pyrmont and Haymarket.
Key Outputs included:
A suite of 22 place-based socio-demographic visualisations
Visual representations of:
Population composition
Cultural diversity
Income vulnerability
Housing stress
Visual assets for presentation and reporting
Outcome:
The project made socio-demographic data accessible and engaging for a broad range of stakeholders and provided a strong visual foundation for understanding social conditions across the precinct.
By situating the data within a visual language that reflects the character of the precinct, the work supported a meaningful understanding of local conditions and offers a foundation for analysing other areas to support place-based policy development and community intervention.